G é Eleição Geral: presidente, governador, senador e deputados. L é Eleição Local (municipal): prefeito e vereador. De 1933 a 1990 o TSE não publica cargo municipal, então esses anos são todos G.
The same office appears twice in the year a place voted on a different date from the rest of the country (because of a postponement, for example).
In 2018, 13 states decided the race for governor in the first round and 14 went to the runoff, according to data from Brazil's Superior Electoral Court (TSE). Counting both rounds, PT elected the most governors (4). Adding up the votes of the candidates each party fielded in the first round, PT had the most votes: 18.9 million votes (19.83% of the votes cast for candidates).
27 state governments, split among 13 parties.
PTPartido dos Trabalhadores414.81%
MDBMovimento Democrático Brasileiro311.11%
PSBPartido Socialista Brasileiro311.11%
PSDBPartido da Social Democracia Brasileira311.11%
PSLPartido Social Liberal311.11%
DEMDemocratas27.41%
PSCPartido Social Cristão27.41%
PSDPartido Social Democrático27.41%
NOVOPartido Novo13.70%
PC do BPartido Comunista do Brasil13.70%
PDTPartido Democrático Trabalhista13.70%
PHSPartido Humanista da Solidariedade13.70%
PPPartido Progressista13.70%
This is not a chamber. Each race here has a single winner; the bar adds up how many state governments each party won nationwide, which measures the party's strength in that election, not a caucus that meets together. Where there was a runoff, its result counts, and each place is counted only once. The party at the election counts: anyone who switched parties after taking office does not change this number.
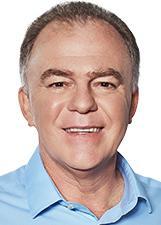
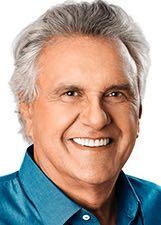
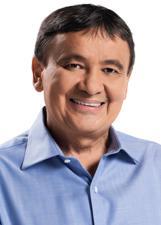
Here are the governors elected in the first round. In the states that had a runoff, we show just below who went to the final race; the result is on the runoff page.
Sum of the votes of the candidates each party ran, nationwide. Where the party backed a candidate from another party, those votes count for the other party; so the sum measures the strength of the party's own candidacies, not of the whole party.
Party
Candidates
Votes
%
PT
16
18,908,791
19.83%
PSDB
12
14,048,096
14.73%
MDB
14
13,518,564
14.18%
PSB
9
9,648,423
10.12%
DEM
8
6,962,454
7.30%
PSD
7
5,695,387
5.97%
NOVO
5
5,163,027
5.41%
PSC
3
3,762,371
3.95%
PSL
12
2,785,414
2.92%
PDT
6
2,775,803
2.91%
PSOL
25
2,459,002
2.58%
PC do B
2
1,893,815
1.99%
PTB
3
1,433,904
1.50%
PP
3
1,085,242
1.14%
PODE
3
792,441
0.83%
PRTB
6
765,083
0.80%
DC
2
748,867
0.79%
REDE
11
600,381
0.63%
PV
2
467,069
0.49%
SOLIDARIEDADE
2
462,137
0.48%
PHS
1
404,484
0.42%
PROS
3
329,944
0.35%
PR
1
280,055
0.29%
PSTU
17
144,213
0.15%
PRP
1
110,973
0.12%
PMN
2
63,777
0.07%
AVANTE
2
19,545
0.02%
PATRI
1
13,472
0.01%
PCO
4
12,480
0.01%
PCB
1
6,534
<0.01%
Registered voters146,750,529
Turned out117,111,572
Abstentions29,638,957
Blank6,418,783
Null15,330,295
Valid95,361,748
Registered voters: voters who could vote. Turnout: how many went to the polls. Abstentions: how many stayed away (registered voters − turnout). Blank and Null: those who turned out but did not choose a valid candidate. Valid: the votes that count for candidates (turnout − blank − null); percentages are calculated on them.
Choose a state above to see all candidates.
Governor is elected by state: each state has its own race, and the national result is their sum.