In 2014, in Santa Catarina, 40 state deputies were elected, according to data from Brazil's Superior Electoral Court (TSE). The largest caucus was that of PMDB (10). The most votes went to Gelson Merisio (PSD), with 119,280 votes (3.36% of the valid votes). The electoral quotient was about 88,791 votes, and the lowest vote total among those elected was 14,986: seats are allocated to the party first.

1Gelson Merisio119,2803.36%
Elected · PSD · No. 55123
Coalition: PSD / DEM / PMDB / PRB

2José Nei Ascari72,7902.05%
Elected · PSD · No. 55111
Coalition: PSD / DEM / PMDB / PRB

3Ismael dos Santos66,8181.88%
Elected · PSD · No. 55777
Coalition: PSD / DEM / PMDB / PRB
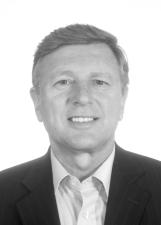
4Milton Hobus66,2711.87%
Elected · PSD · No. 55858
Coalition: PSD / DEM / PMDB / PRB
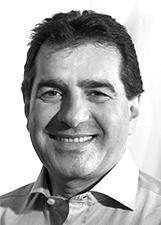
5Valdir Cobalchini62,8651.77%
Elected · PMDB · No. 15200
Coalition: PSD / DEM / PMDB / PRB

6Aldo Schneider58,6461.65%
Elected · PMDB · No. 15010
Coalition: PSD / DEM / PMDB / PRB

7Gean Loureiro58,2391.64%
Elected · PMDB · No. 15650
Coalition: PSD / DEM / PMDB / PRB

8Jean Kuhlmann56,4681.59%
Elected · PSD · No. 55800
Coalition: PSD / DEM / PMDB / PRB
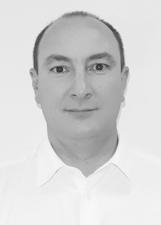
9De Nadal54,1101.52%
Elected · PMDB · No. 15220
Coalition: PSD / DEM / PMDB / PRB
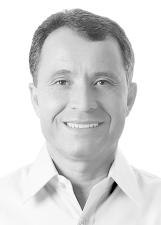
10Darci de Matos53,3211.50%
Elected · PSD · No. 55000
Coalition: PSD / DEM / PMDB / PRB
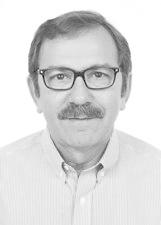
11Serafim Venzon50,2321.41%
Elected · PSDB · No. 45145
Coalition: PSDB / PATRIOTA
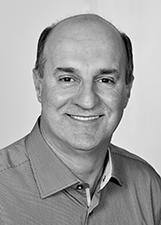
12Zé Milton49,4891.39%
Elected · PP · No. 11234
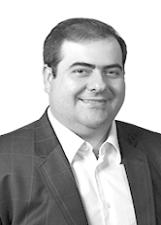
13Chiodini49,2331.39%
Elected · PMDB · No. 15444
Coalition: PSD / DEM / PMDB / PRB

14Marcos Vieira48,2871.36%
Elected · PSDB · No. 45699
Coalition: PSDB / PATRIOTA

15Ada de Luca47,8131.35%
Elected · PMDB · No. 15015
Coalition: PSD / DEM / PMDB / PRB
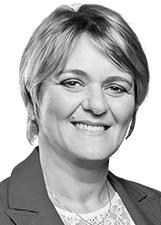
16Luciane Carminatti45,2481.27%
Elected · PT · No. 13601
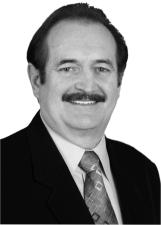
17Parisotto44,3651.25%
Elected · DEM · No. 25104
Coalition: PSD / DEM / PMDB / PRB
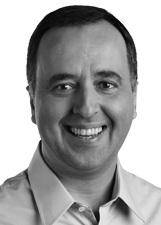
18Kennedy Nunes44,0191.24%
Elected · PSD · No. 55100
Coalition: PSD / DEM / PMDB / PRB
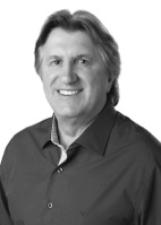
19Leonel Pavan43,4701.22%
Elected · PSDB · No. 45678
Coalition: PSDB / PATRIOTA
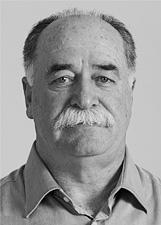
20Titon42,2641.19%
Elected · PMDB · No. 15270
Coalition: PSD / DEM / PMDB / PRB
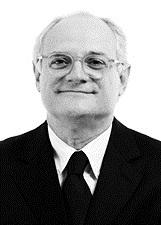
21Dr. Vicente41,0891.16%
Elected · PSDB · No. 45999
Coalition: PSDB / PATRIOTA

22Dóia Guglielmi41,0521.16%
Alternate · PSDB · No. 45111
Coalition: PSDB / PATRIOTA
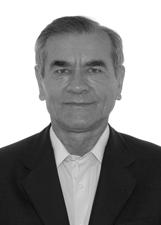
23Sílvio Dreveck40,5181.14%
Elected · PP · No. 11311
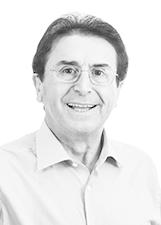
24Antonio Aguiar39,7141.12%
Elected · PMDB · No. 15700
Coalition: PSD / DEM / PMDB / PRB
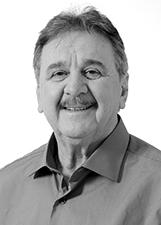
25Moacir Sopelsa39,0411.10%
Elected · PMDB · No. 15180
Coalition: PSD / DEM / PMDB / PRB

26Neodi Saretta37,9771.07%
Elected · PT · No. 13120

27Ana Paula36,8931.04%
Elected · PT · No. 13313

28Mauricio Eskudlark36,2801.02%
Elected (remainder seat) · PSD · No. 55555
Coalition: PSD / DEM / PMDB / PRB

29Gabriel Ribeiro36,1871.02%
Elected (remainder seat) · PSD · No. 55282
Coalition: PSD / DEM / PMDB / PRB

30Dirce Heiderscheidt35,9971.01%
Elected (remainder seat) · PMDB · No. 15234
Coalition: PSD / DEM / PMDB / PRB

31Luiz Fernando (vampiro)35,7991.01%
Alternate · PMDB · No. 15150
Coalition: PSD / DEM / PMDB / PRB
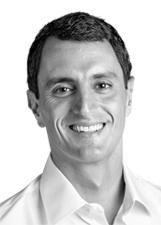
32João Amin34,6660.98%
Elected · PP · No. 11333
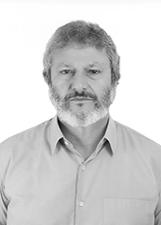
33Padre Pedro33,7320.95%
Elected · PT · No. 13987
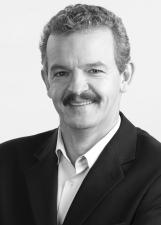
34Dirceu Dresch33,2200.94%
Elected (remainder seat) · PT · No. 13450
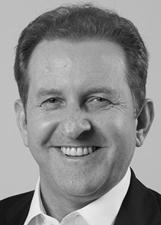
35Valmir Comin32,7300.92%
Elected · PP · No. 11166
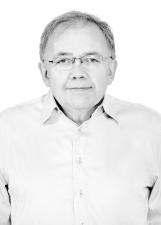
36Coruja31,7970.90%
Alternate · PMDB · No. 15016
Coalition: PSD / DEM / PMDB / PRB

37Ricardo Guidi31,7040.89%
Elected · PPS · No. 23456
Coalition: PSB / PPS / PTC / PHS / PSL / PT do B / PRTB / PTN / SD
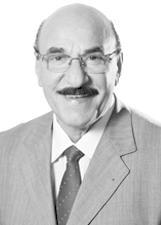
38Manoel Mota31,6800.89%
Alternate · PMDB · No. 15157
Coalition: PSD / DEM / PMDB / PRB
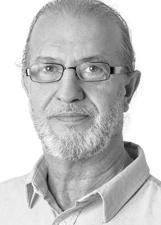
39Nilson Gonçalves30,7020.86%
Alternate · PSDB · No. 45777
Coalition: PSDB / PATRIOTA
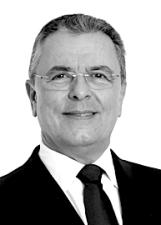
40Doutor Dalmo29,8600.84%
Alternate · PMDB · No. 15400
Coalition: PSD / DEM / PMDB / PRB
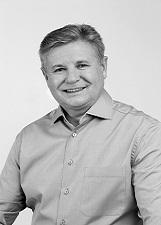
41Berlanda29,7560.84%
Alternate · DEM · No. 25025
Coalition: PSD / DEM / PMDB / PRB
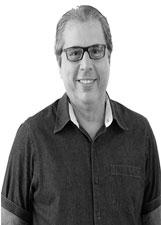
42Marco Antonio Wanrowsky29,5850.83%
Alternate · PSDB · No. 45045
Coalition: PSDB / PATRIOTA

43Altair Silva28,9920.82%
Alternate · PP · No. 11130
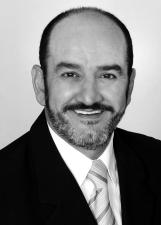
44Roberto Salum27,9200.79%
Alternate · PSD · No. 55789
Coalition: PSD / DEM / PMDB / PRB
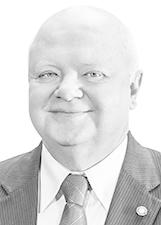
45Renato Hinnig27,6990.78%
Alternate · PMDB · No. 15321
Coalition: PSD / DEM / PMDB / PRB

46Mário Marcondes27,6270.78%
Elected · PR · No. 22580

47Jailson Lima27,4340.77%
Alternate · PT · No. 13470

48Wanderley Agostini27,3910.77%
Alternate · PSD · No. 55200
Coalition: PSD / DEM / PMDB / PRB
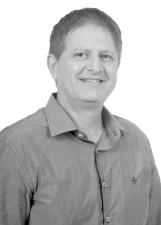
49Grando27,2980.77%
Alternate · PMDB · No. 15600
Coalition: PSD / DEM / PMDB / PRB

50Bispo Jeronimo Alves27,2610.77%
Alternate · PRB · No. 10123
Coalition: PSD / DEM / PMDB / PRB
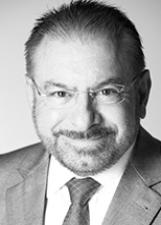
51Volnei Morastoni27,0690.76%
Alternate · PT · No. 13111

52Rodrigo Minotto26,9290.76%
Elected · PDT · No. 12345
Coalition: PDT / PROS / PTB / PC do B / PSDC / PV

53Soldado Lotin23,5070.66%
PSOL · No. 50789
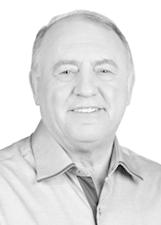
54Natalino Lazare20,9320.59%
Elected · PR · No. 22225

55Dr. Elcio19,4750.55%
Alternate · DEM · No. 25777
Coalition: PSD / DEM / PMDB / PRB
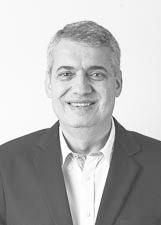
56Ivon de Souza19,4350.55%
Alternate · PR · No. 22190

57Patrício Destro19,3920.55%
Elected · PSB · No. 40123
Coalition: PSB / PPS / PTC / PHS / PSL / PT do B / PRTB / PTN / SD

58Roni Wan-Dall18,5290.52%
Alternate · PP · No. 11011
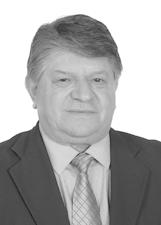
59Osvaldo Gern18,4160.52%
Alternate · PP · No. 11777

60Valduga18,2440.51%
Elected · PC do B · No. 65123
Coalition: PDT / PROS / PTB / PC do B / PSDC / PV

61Beto Passos17,9280.50%
Alternate · PT · No. 13613

62Marcius Machado17,2480.49%
Alternate · PR · No. 22233

63Carlao16,6060.47%
Alternate · PMDB · No. 15735
Coalition: PSD / DEM / PMDB / PRB

64Hebert Werka16,6010.47%
Alternate · PR · No. 22456

65Fabio Dalonso16,5340.47%
Alternate · PSDB · No. 45456
Coalition: PSDB / PATRIOTA

66Deka May16,4030.46%
Alternate · PP · No. 11222

67Elson Manoel Pereira16,2040.46%
PSOL · No. 50150
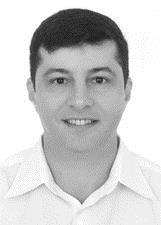
68Fábio Flor15,7140.44%
Alternate · PP · No. 11911
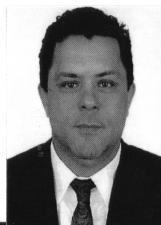
69Ivan Naatz15,6480.44%
Alternate · PDT · No. 12012
Coalition: PDT / PROS / PTB / PC do B / PSDC / PV
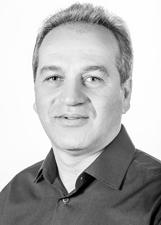
70Elmis15,4110.43%
Alternate · PMDB · No. 15215
Coalition: PSD / DEM / PMDB / PRB
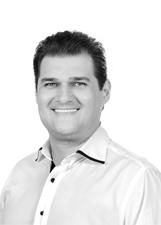
71Salvaro14,9860.42%
Elected (remainder seat) · PSB · No. 40110
Coalition: PSB / PPS / PTC / PHS / PSL / PT do B / PRTB / PTN / SD

72Sidney Sabel14,2210.40%
Alternate · PP · No. 11711
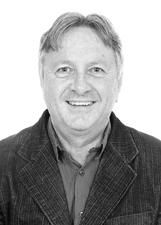
73Danilo Rezini14,2140.40%
Alternate · PMDB · No. 15000
Coalition: PSD / DEM / PMDB / PRB

74Joao Carlos Gonçalves14,0110.39%
Alternate · PMDB · No. 15777
Coalition: PSD / DEM / PMDB / PRB

75Gervásio Silva13,9010.39%
Alternate · PP · No. 11580

76Matusa13,7040.39%
Alternate · PT · No. 13650
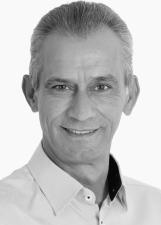
77Vanderlei de Oliveira13,2740.37%
Alternate · PT · No. 13000

78Evandro Almeida13,0470.37%
Alternate · PMDB · No. 15690
Coalition: PSD / DEM / PMDB / PRB
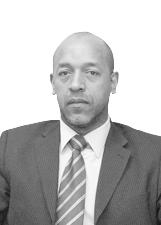
79Pastor Jevis12,9360.36%
Alternate · PDT · No. 12144
Coalition: PDT / PROS / PTB / PC do B / PSDC / PV

80Níkolas Reis12,8600.36%
Alternate · PROS · No. 90123
Coalition: PDT / PROS / PTB / PC do B / PSDC / PV
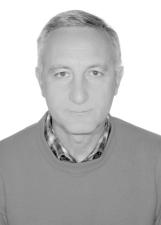
81Vicente Saliba12,8080.36%
Alternate · PDT · No. 12123
Coalition: PDT / PROS / PTB / PC do B / PSDC / PV
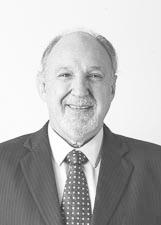
82Claudio Dalvesco12,7030.36%
Alternate · PR · No. 22015
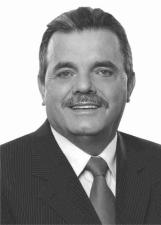
83Pitanta12,1890.34%
Alternate · DEM · No. 25624
Coalition: PSD / DEM / PMDB / PRB
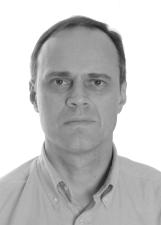
84Prof. James11,2720.32%
Alternate · PDT · No. 12000
Coalition: PDT / PROS / PTB / PC do B / PSDC / PV
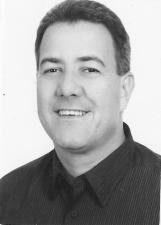
85Jean Leutprecht10,7810.30%
Alternate · PC do B · No. 65065
Coalition: PDT / PROS / PTB / PC do B / PSDC / PV

86Julio Ronconi10,5870.30%
Alternate · PSB · No. 40222
Coalition: PSB / PPS / PTC / PHS / PSL / PT do B / PRTB / PTN / SD

87Juliano Pedrini10,5530.30%
Alternate · PT · No. 13181
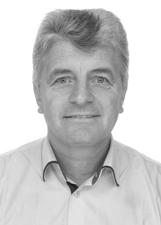
88Cirio Vandresen9,8250.28%
Alternate · PT · No. 13130
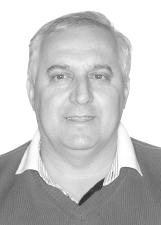
89Zeca Bombeiro9,7380.27%
Alternate · SD · No. 77193
Coalition: PSB / PPS / PTC / PHS / PSL / PT do B / PRTB / PTN / SD
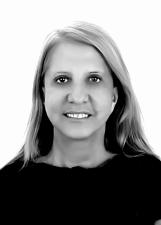
90Beth Tiscoski9,5340.27%
Alternate · PP · No. 11111
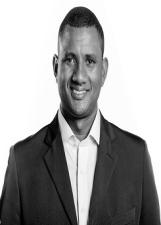
91Sandro Silva9,5300.27%
Alternate · PPS · No. 23123
Coalition: PSB / PPS / PTC / PHS / PSL / PT do B / PRTB / PTN / SD
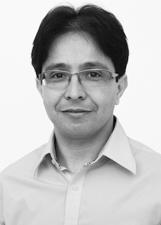
92Rosenvaldo Junior9,4380.27%
Alternate · PT · No. 13123

93Bento9,3460.26%
Alternate · PT · No. 13913
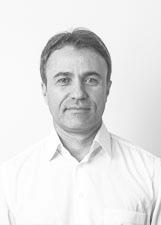
94Ricardo Grando9,2870.26%
Alternate · PR · No. 22123
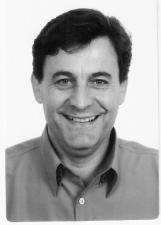
95Amarildo Rampelotti9,0630.26%
Alternate · PT · No. 13456

96Marcio Sander9,0110.25%
Alternate · PR · No. 22567
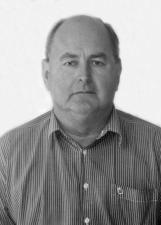
97Rubens Borchardt9,0090.25%
Alternate · PT · No. 13444
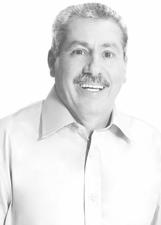
98Renatinho8,8360.25%
Alternate · PP · No. 11456
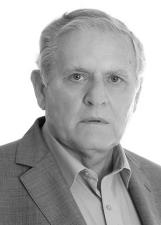
99Ivo Konell8,7930.25%
Alternate · PSB · No. 40044
Coalition: PSB / PPS / PTC / PHS / PSL / PT do B / PRTB / PTN / SD

100Marcelo Schrubbe8,6690.24%
Alternate · PSB · No. 40193
Coalition: PSB / PPS / PTC / PHS / PSL / PT do B / PRTB / PTN / SD

101Cesar Parana8,6170.24%
Alternate · PTC · No. 36123
Coalition: PSB / PPS / PTC / PHS / PSL / PT do B / PRTB / PTN / SD
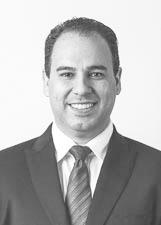
102Clayton Batschauer8,0850.23%
Alternate · PR · No. 22000
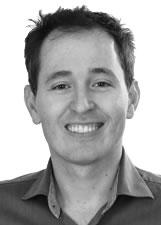
103Leonardo Secchi8,0100.23%
Alternate · PSB · No. 40567
Coalition: PSB / PPS / PTC / PHS / PSL / PT do B / PRTB / PTN / SD
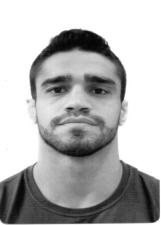
104Thiago Tavares7,9800.22%
Alternate · PC do B · No. 65500
Coalition: PDT / PROS / PTB / PC do B / PSDC / PV
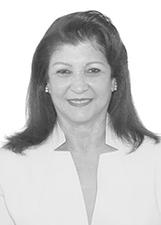
105Professora Odete de Jesus7,9040.22%
Alternate · PTN · No. 19333
Coalition: PSB / PPS / PTC / PHS / PSL / PT do B / PRTB / PTN / SD
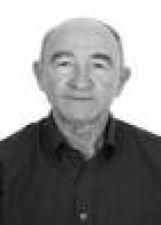
106Taxista Voltolini7,8710.22%
Alternate · PPS · No. 23455
Coalition: PSB / PPS / PTC / PHS / PSL / PT do B / PRTB / PTN / SD
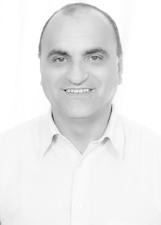
107Nilton Freitas7,6030.21%
Alternate · PTB · No. 14500
Coalition: PDT / PROS / PTB / PC do B / PSDC / PV
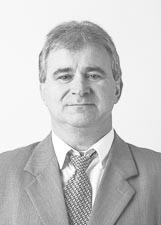
108Eder Mattos7,4420.21%
Alternate · PR · No. 22789
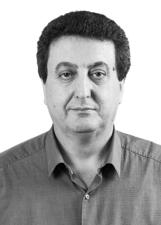
109Gelson Padilha7,4230.21%
Alternate · PP · No. 11345

110Salete Cardoso7,3730.21%
Alternate · PV · No. 43456
Coalition: PDT / PROS / PTB / PC do B / PSDC / PV
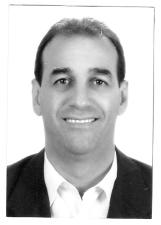
111Itamar Agnoletto7,2660.20%
Alternate · PSDB · No. 45688
Coalition: PSDB / PATRIOTA

112Edinho Olegario6,9320.20%
Alternate · PDT · No. 12112
Coalition: PDT / PROS / PTB / PC do B / PSDC / PV
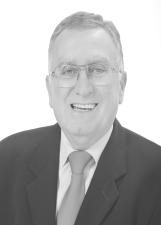
113Sergio Godinho6,8810.19%
Alternate · PSB · No. 40300
Coalition: PSB / PPS / PTC / PHS / PSL / PT do B / PRTB / PTN / SD
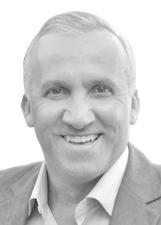
114Joel da Costa6,7430.19%
Alternate · PMDB · No. 15007
Coalition: PSD / DEM / PMDB / PRB

115Jaime Evaristo6,5570.18%
PSC · No. 20630

116Marcelo Werner6,5450.18%
Alternate · PC do B · No. 65100
Coalition: PDT / PROS / PTB / PC do B / PSDC / PV

117Rose Bartucheski6,5140.18%
Alternate · PSD · No. 55678
Coalition: PSD / DEM / PMDB / PRB

118Mariah Nascimento Pereira6,3030.18%
Alternate · PSB · No. 40321
Coalition: PSB / PPS / PTC / PHS / PSL / PT do B / PRTB / PTN / SD

119Mario Withoeft6,0780.17%
Alternate · PP · No. 11033

120Pinheiro6,0720.17%
Alternate · PSDB · No. 45000
Coalition: PSDB / PATRIOTA

121Pedro Chagas6,0150.17%
PSOL · No. 50555

122Junqueira Junior6,0040.17%
Alternate · PR · No. 22090
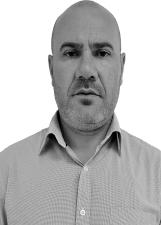
123Marcos Scarpato5,9930.17%
Alternate · PT · No. 13280
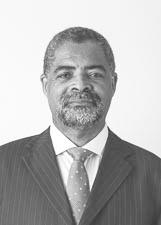
124Prof. Maurício da Silva5,9370.17%
Alternate · PR · No. 22223

125Zuse5,9330.17%
Alternate · PP · No. 11211

126Deglaber Goulart5,8900.17%
Alternate · PMDB · No. 15369
Coalition: PSD / DEM / PMDB / PRB

127Leonel Camasão5,8070.16%
PSOL · No. 50500

128Luizinho Campos5,5400.16%
Alternate · PSB · No. 40888
Coalition: PSB / PPS / PTC / PHS / PSL / PT do B / PRTB / PTN / SD

129Dr Mello5,5020.15%
Alternate · PT · No. 13001

130Juliano da Autoescola5,2910.15%
Alternate · PP · No. 11789
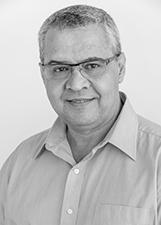
131Gelson Albuquerque5,2720.15%
Alternate · PSB · No. 40140
Coalition: PSB / PPS / PTC / PHS / PSL / PT do B / PRTB / PTN / SD
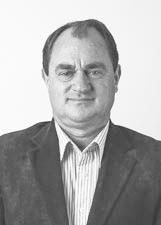
132Tomazi5,2250.15%
Alternate · PR · No. 22333
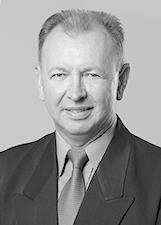
133Irineu Berezanski5,1090.14%
Alternate · PSB · No. 40444
Coalition: PSB / PPS / PTC / PHS / PSL / PT do B / PRTB / PTN / SD
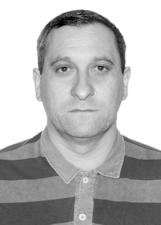
134Johnny Coelho4,9960.14%
Alternate · PP · No. 11193
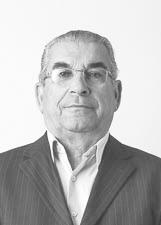
135João da Bega4,8270.14%
Alternate · PR · No. 22690
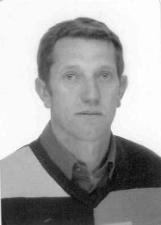
136Fically - Itacir Fiorese4,7170.13%
Alternate · PSB · No. 40999
Coalition: PSB / PPS / PTC / PHS / PSL / PT do B / PRTB / PTN / SD

137Clemir Spinelli4,6850.13%
Alternate · PSDB · No. 45776
Coalition: PSDB / PATRIOTA
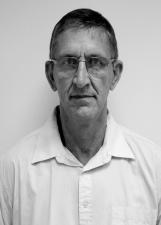
138Moacir Nazário4,5960.13%
Alternate · PT · No. 13134

139Paula Pelos Animais4,5710.13%
PSC · No. 20678

140Jocimar Lima4,5440.13%
Alternate · PSDC · No. 27333
Coalition: PDT / PROS / PTB / PC do B / PSDC / PV

141Gildo Masselai4,4300.12%
Alternate · PP · No. 11250
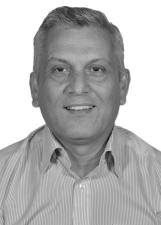
142Oderi4,3420.12%
Alternate · PC do B · No. 65789
Coalition: PDT / PROS / PTB / PC do B / PSDC / PV
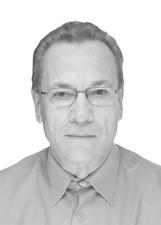
143Ernesto Bernardino4,3190.12%
Alternate · PP · No. 11999
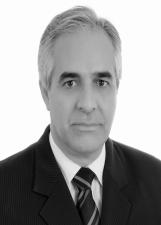
144Cabo Loro4,2640.12%
Alternate · PROS · No. 90777
Coalition: PDT / PROS / PTB / PC do B / PSDC / PV
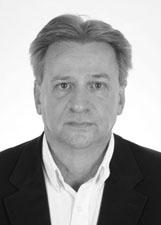
145Newton Sché3,7510.11%
Alternate · PSB · No. 40800
Coalition: PSB / PPS / PTC / PHS / PSL / PT do B / PRTB / PTN / SD
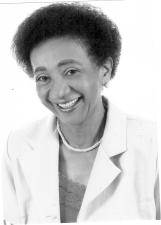
146Maria Lucia3,6490.10%
PSC · No. 20021
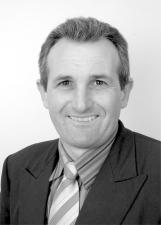
147Piccinin3,5460.10%
Alternate · PSB · No. 40122
Coalition: PSB / PPS / PTC / PHS / PSL / PT do B / PRTB / PTN / SD
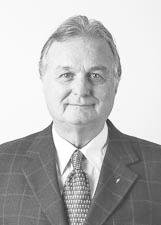
148Dr. Silvestre3,5070.10%
Alternate · PR · No. 22222
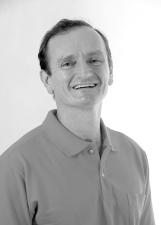
149Professor Josemir3,3610.09%
PSOL · No. 50005

150Beto Gebaili3,3490.09%
Alternate · PRB · No. 10999
Coalition: PSD / DEM / PMDB / PRB
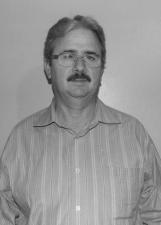
151João Beltrame3,3110.09%
PSC · No. 20955
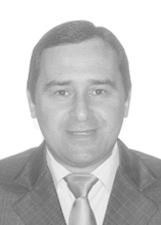
152Josué Pereira3,1390.09%
Alternate · PP · No. 11123
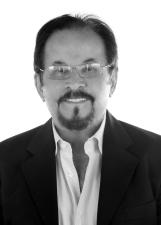
153Odilon Ferreira de Oliveira3,1160.09%
Alternate · PPS · No. 23015
Coalition: PSB / PPS / PTC / PHS / PSL / PT do B / PRTB / PTN / SD

154Cleony (cléo) Figur3,0170.08%
Alternate · PSD · No. 55999
Coalition: PSD / DEM / PMDB / PRB
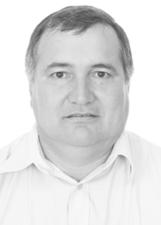
155Pompeo2,9550.08%
Alternate · PSDB · No. 45450
Coalition: PSDB / PATRIOTA

156Macieski2,8650.08%
Alternate · PMDB · No. 15115
Coalition: PSD / DEM / PMDB / PRB
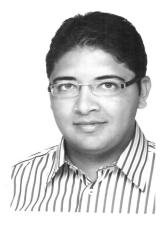
157Renato Muniz2,6320.07%
PSC · No. 20123
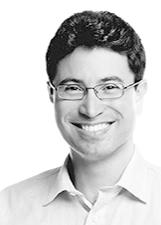
158Professor Matheus2,6110.07%
Alternate · PC do B · No. 65200
Coalition: PDT / PROS / PTB / PC do B / PSDC / PV

159Pedro Bastos2,5790.07%
Alternate · PP · No. 11369
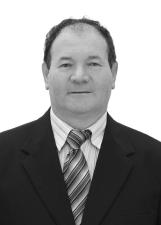
160Adair Ceron2,5040.07%
Alternate · PSB · No. 40240
Coalition: PSB / PPS / PTC / PHS / PSL / PT do B / PRTB / PTN / SD

161Barriga Papeleiro2,4100.07%
Alternate · PR · No. 22667

162Mauricio Maia2,3880.07%
Alternate · PT · No. 13789
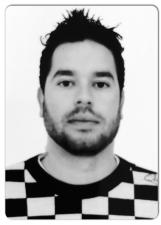
163Pablo Calluans2,3020.06%
Alternate · PSDB · No. 45123
Coalition: PSDB / PATRIOTA
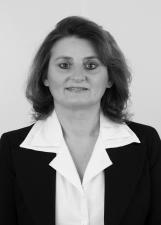
164Marlene Kayser2,2870.06%
Alternate · PP · No. 11321

165Rafael Melo2,2180.06%
PSOL · No. 50100

166Rodrigo Falchetti2,1730.06%
Alternate · PV · No. 43013
Coalition: PDT / PROS / PTB / PC do B / PSDC / PV
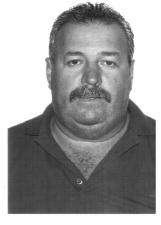
167Ernesto da Igreja2,1450.06%
PSC · No. 20999
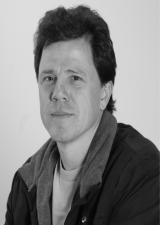
168Marquinhos2,0940.06%
Alternate · PT · No. 13027
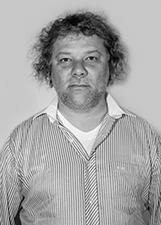
169Kleber da Kek2,0200.06%
Alternate · PP · No. 11145
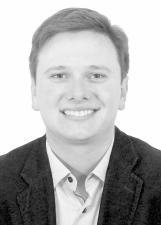
170Luiz Peruzzolo1,9380.05%
Alternate · PSB · No. 40789
Coalition: PSB / PPS / PTC / PHS / PSL / PT do B / PRTB / PTN / SD
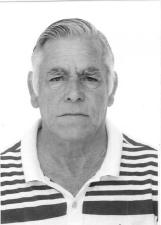
171Euclides Quidinho1,9050.05%
PSC · No. 20611

172Zica Osmar1,8950.05%
Alternate · PTC · No. 36780
Coalition: PSB / PPS / PTC / PHS / PSL / PT do B / PRTB / PTN / SD
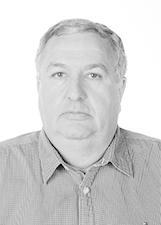
173Toninho Pagani1,8720.05%
Alternate · PP · No. 11135

174Josiel Nunes da Silva1,7330.05%
PSC · No. 20250
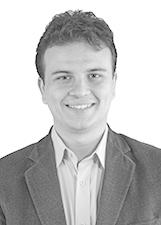
175Edenilson Petter1,7270.05%
Alternate · PT · No. 13113

176Márcio Poletto1,7110.05%
Alternate · PR · No. 22200
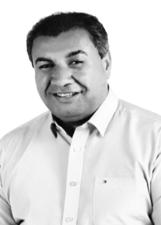
177José Wilson1,7090.05%
Alternate · PTB · No. 14100
Coalition: PDT / PROS / PTB / PC do B / PSDC / PV
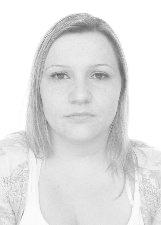
178Claudia Pacheco1,7040.05%
Alternate · PV · No. 43430
Coalition: PDT / PROS / PTB / PC do B / PSDC / PV

179Professor Marcos1,6570.05%
Alternate · PV · No. 43210
Coalition: PDT / PROS / PTB / PC do B / PSDC / PV
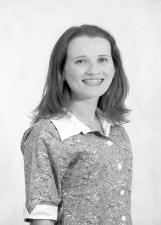
180Geórgia1,6490.05%
PSOL · No. 50050

181Silva Bombeiro1,5800.04%
Alternate · PR · No. 22254
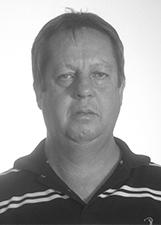
182Manjuva Caminhoneiro1,5560.04%
Alternate · PP · No. 11113
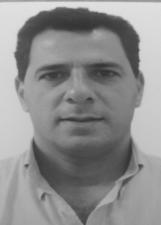
183Alexandre Lemos1,5060.04%
Alternate · PSB · No. 40007
Coalition: PSB / PPS / PTC / PHS / PSL / PT do B / PRTB / PTN / SD

184Cacique Hyral1,4770.04%
Alternate · PV · No. 43433
Coalition: PDT / PROS / PTB / PC do B / PSDC / PV
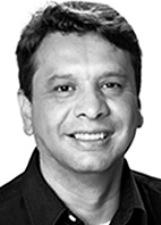
185Mario1,4720.04%
Alternate · PT · No. 13013

186Professor Domingos1,4470.04%
Alternate · PT · No. 13007

187Bartira1,4440.04%
Alternate · PR · No. 22022
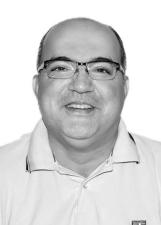
188Jean Henrique da Silva1,4320.04%
Alternate · PPS · No. 23023
Coalition: PSB / PPS / PTC / PHS / PSL / PT do B / PRTB / PTN / SD
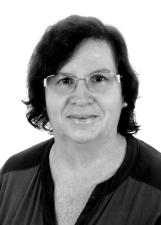
189Helenice1,4130.04%
Alternate · PT · No. 13707
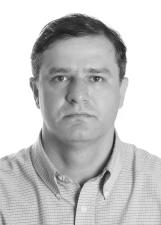
190Airton Fernandes1,3830.04%
PSC · No. 20133

191Luciano Roberto Fischer1,3640.04%
Alternate · PDT · No. 12121
Coalition: PDT / PROS / PTB / PC do B / PSDC / PV
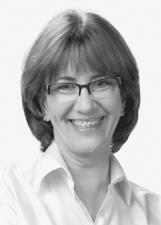
192Luciane Pereira1,3110.04%
Alternate · PT · No. 13413

193Cabo Adriana1,2870.04%
PSOL · No. 50580
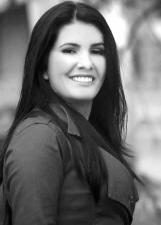
194Sarah Maciel1,2680.04%
PSC · No. 20077
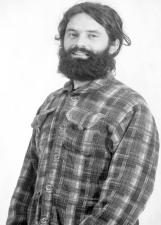
195Vina da Caverna1,2450.04%
PSOL · No. 50420
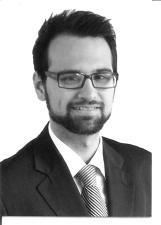
196John Fortunato1,2320.03%
Alternate · PEN · No. 51007
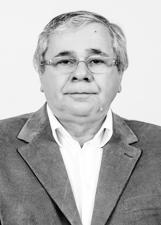
197Professor Celso O. de Souza1,2080.03%
Alternate · PDT · No. 12018
Coalition: PDT / PROS / PTB / PC do B / PSDC / PV

198Adilson Braun1,2070.03%
Alternate · PV · No. 43084
Coalition: PDT / PROS / PTB / PC do B / PSDC / PV
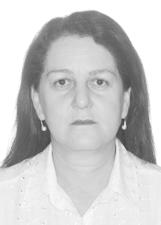
199Dalva Assini1,1100.03%
Alternate · PTB · No. 14014
Coalition: PDT / PROS / PTB / PC do B / PSDC / PV
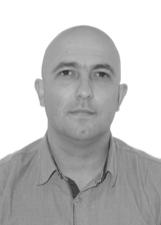
200Alexandre Braggio1,0620.03%
Alternate · PP · No. 11233

201Coronel Fátima1,0390.03%
Alternate · PR · No. 22345

202Silvio Schatt1,0130.03%
PSC · No. 20234
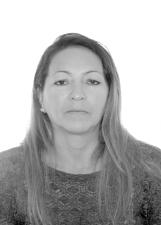
203Professora Elci - A Nega1,0050.03%
Alternate · PC do B · No. 65256
Coalition: PDT / PROS / PTB / PC do B / PSDC / PV
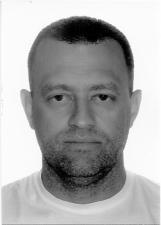
204Marcus Sodré1,0020.03%
PSTU · No. 16016
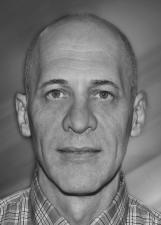
205Mauro Beal9730.03%
Alternate · PEN · No. 51555

206Claudio Beduschi Antoniolli9540.03%
Alternate · PDT · No. 12007
Coalition: PDT / PROS / PTB / PC do B / PSDC / PV
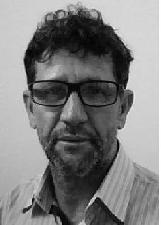
207Chico do Rabazedo8940.03%
Alternate · PHS · No. 31023
Coalition: PSB / PPS / PTC / PHS / PSL / PT do B / PRTB / PTN / SD
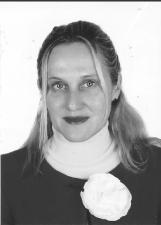
208Mapi Cravo8790.02%
Alternate · PSDB · No. 45125
Coalition: PSDB / PATRIOTA
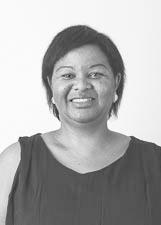
209India Favorino8700.02%
Alternate · PR · No. 22888
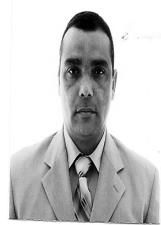
210Hoffmann8580.02%
PSC · No. 20987
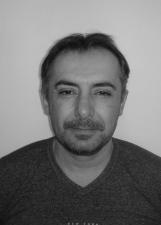
211Jeovanny de Luch8580.02%
PSC · No. 20111

212Janete Martini8470.02%
Alternate · PSDB · No. 45283
Coalition: PSDB / PATRIOTA

213Murilo Azevedo8450.02%
PSOL · No. 50123
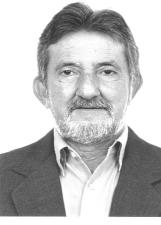
214Arno de Souza8390.02%
PSC · No. 20054

215Douglas Pedroso Otto8180.02%
PMN · No. 33333
Coalition: PPL / PMN
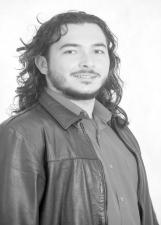
216Professor Willian Meister8120.02%
PSOL · No. 50001
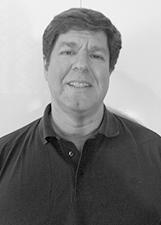
217Professor Mauri8020.02%
Alternate · PTN · No. 19019
Coalition: PSB / PPS / PTC / PHS / PSL / PT do B / PRTB / PTN / SD
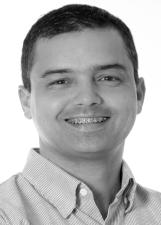
218Jefferson Schmidt7700.02%
Alternate · PEN · No. 51900

219Marcio Goes7600.02%
Alternate · PC do B · No. 65300
Coalition: PDT / PROS / PTB / PC do B / PSDC / PV

220Dra. Carol Igreja7050.02%
Alternate · PDT · No. 12456
Coalition: PDT / PROS / PTB / PC do B / PSDC / PV
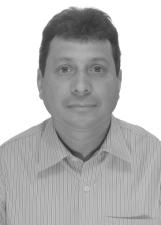
221Antonio Carlos6860.02%
Alternate · PSB · No. 40777
Coalition: PSB / PPS / PTC / PHS / PSL / PT do B / PRTB / PTN / SD

222Leonir Minozzo6860.02%
PSC · No. 20000
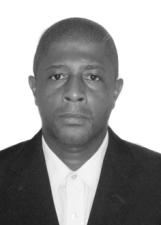
223Marcos Paulo6780.02%
PPL · No. 54444
Coalition: PPL / PMN
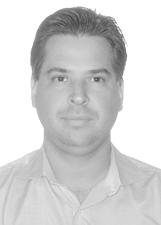
224André Gonçalves6760.02%
Alternate · PEN · No. 51000

225Marcos Pinar Marcao6740.02%
Alternate · PT · No. 13690

226Renato Sartori6730.02%
Alternate · PEN · No. 51777
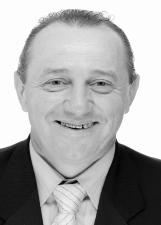
227Vander Schons6720.02%
Alternate · PSDB · No. 45676
Coalition: PSDB / PATRIOTA

228Elisa Ferreira6700.02%
PSOL · No. 50300
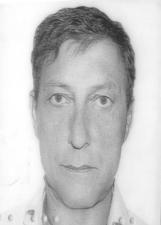
229Renei Roberto Popper6450.02%
PSC · No. 20612
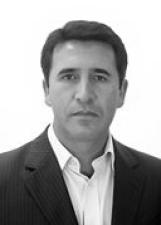
230Rogério Ortiz6320.02%
PSC · No. 20100
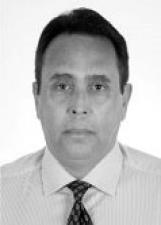
231Lenilso Machado Pinto6310.02%
Alternate · PDT · No. 12100
Coalition: PDT / PROS / PTB / PC do B / PSDC / PV
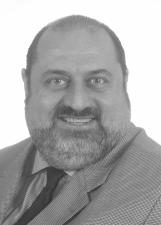
232Apostolo Pitsica6290.02%
Alternate · PTC · No. 36999
Coalition: PSB / PPS / PTC / PHS / PSL / PT do B / PRTB / PTN / SD

233Paulinho de Deus6050.02%
Alternate · PV · No. 43123
Coalition: PDT / PROS / PTB / PC do B / PSDC / PV
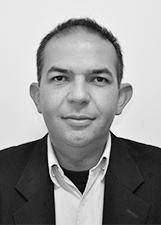
234Gilberto Luiz5990.02%
Alternate · PV · No. 43000
Coalition: PDT / PROS / PTB / PC do B / PSDC / PV

235Cesar Techio5890.02%
PSC · No. 20007

236Edenir Melo Ventura5790.02%
PRP · No. 44444

237Eliane Cristina5540.02%
Alternate · PDT · No. 12312
Coalition: PDT / PROS / PTB / PC do B / PSDC / PV
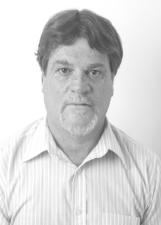
238Pintado5510.02%
Alternate · PV · No. 43043
Coalition: PDT / PROS / PTB / PC do B / PSDC / PV
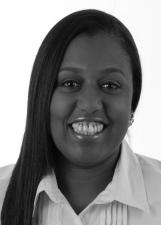
239Mara Ferve5440.02%
Alternate · PSDB · No. 45996
Coalition: PSDB / PATRIOTA

240Amenar de Oliveira5430.02%
Alternate · PV · No. 43333
Coalition: PDT / PROS / PTB / PC do B / PSDC / PV
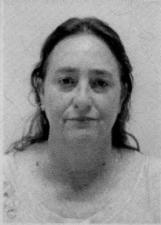
241Sulei Lima5260.01%
PSC · No. 20222
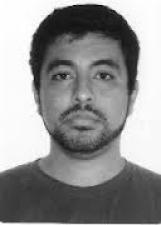
242Tião Amaral5200.01%
PSTU · No. 16116
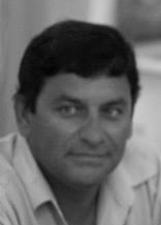
243Assis5180.01%
PSC · No. 20620
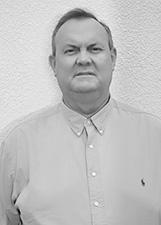
244Ricardão5180.01%
Alternate · PDT · No. 12333
Coalition: PDT / PROS / PTB / PC do B / PSDC / PV

245Thiago Praxedes5170.01%
PSC · No. 20567
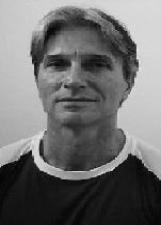
246Professor Jose Luiz Vaz5090.01%
Alternate · PHS · No. 31313
Coalition: PSB / PPS / PTC / PHS / PSL / PT do B / PRTB / PTN / SD

247Braguinha4910.01%
PSC · No. 20800
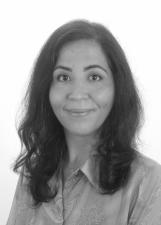
248Luciana Biondo4910.01%
Alternate · PSDB · No. 45001
Coalition: PSDB / PATRIOTA

249Jorginho Lautert4900.01%
Alternate · PSDB · No. 45007
Coalition: PSDB / PATRIOTA
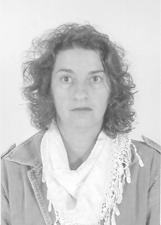
250Sueli Aparecida de Souza4860.01%
Alternate · PP · No. 11190
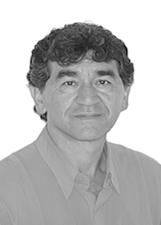
251Darci Chutando Balde4850.01%
Alternate · PTN · No. 19999
Coalition: PSB / PPS / PTC / PHS / PSL / PT do B / PRTB / PTN / SD
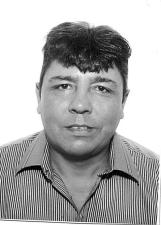
252Cantor Heroi4810.01%
PSC · No. 20020
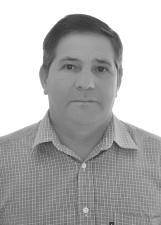
253Antonio Deolindo4800.01%
Alternate · PV · No. 43500
Coalition: PDT / PROS / PTB / PC do B / PSDC / PV
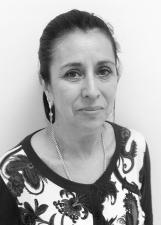
254Neiva Passos Miguel4790.01%
Alternate · PSDB · No. 45019
Coalition: PSDB / PATRIOTA

255Renata Matiello4560.01%
Alternate · PEN · No. 51051
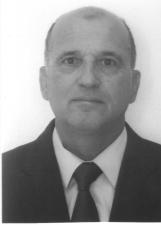
256Mario Cesar4460.01%
PSC · No. 20010
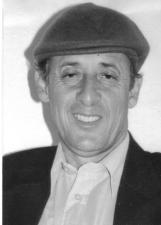
257Joãozinho do Cd4420.01%
PSC · No. 20150
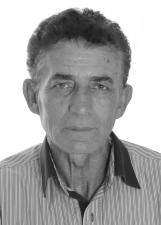
258Juarez Santiago4360.01%
Alternate · PT do B · No. 70000
Coalition: PSB / PPS / PTC / PHS / PSL / PT do B / PRTB / PTN / SD
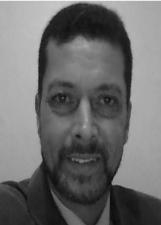
259Paulino Barbosa4340.01%
PSC · No. 20618
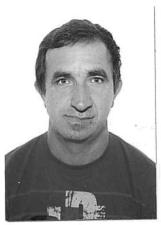
260Manoel de Oliveira4260.01%
PSC · No. 20615
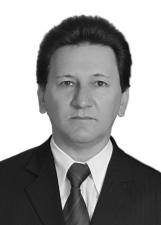
261Carmelito Smieguel4230.01%
PRP · No. 44123
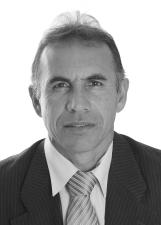
262Jonivaldo Mateus4140.01%
PSC · No. 20707
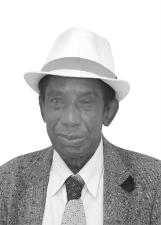
263Geneval Idalino4120.01%
PPL · No. 54234
Coalition: PPL / PMN
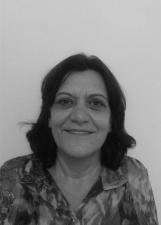
264Izolete Mendes4100.01%
PSC · No. 20032

265Fabio Koester3980.01%
PSC · No. 20300
266Professora Kika3970.01%
PSC · No. 20888
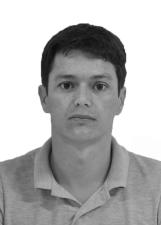
267Leandro Goulart3950.01%
Alternate · PPS · No. 23321
Coalition: PSB / PPS / PTC / PHS / PSL / PT do B / PRTB / PTN / SD
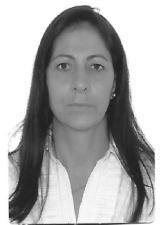
268Dileta Pensin3840.01%
Alternate · PSDB · No. 45333
Coalition: PSDB / PATRIOTA
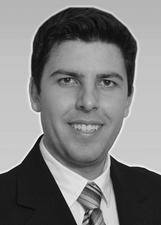
269Rodrigo Conradi Cema3730.01%
Alternate · PT do B · No. 70201
Coalition: PSB / PPS / PTC / PHS / PSL / PT do B / PRTB / PTN / SD
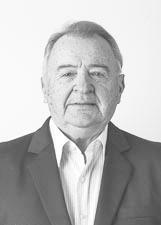
270Dr. Ingo3600.01%
Alternate · PR · No. 22975
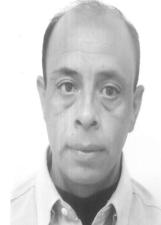
271Wilson Araujo3560.01%
PSC · No. 20120
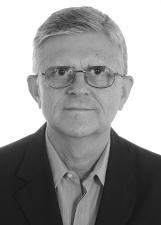
272Eliseu355<0.01%
Alternate · PSB · No. 40400
Coalition: PSB / PPS / PTC / PHS / PSL / PT do B / PRTB / PTN / SD

273Eliz Bosco355<0.01%
PRP · No. 44111

274Célio do PV352<0.01%
Alternate · PV · No. 43323
Coalition: PDT / PROS / PTB / PC do B / PSDC / PV
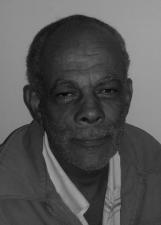
275Paulo Coelho349<0.01%
PSC · No. 20027
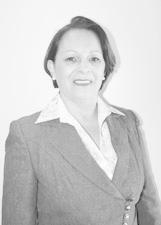
276Vanir Feliciano345<0.01%
Alternate · PMDB · No. 15915
Coalition: PSD / DEM / PMDB / PRB
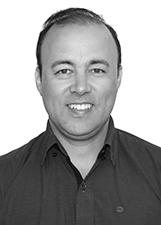
277Xandi Figueiredo345<0.01%
Alternate · PRB · No. 10777
Coalition: PSD / DEM / PMDB / PRB
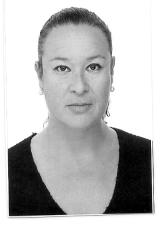
278Ana do PV342<0.01%
Alternate · PV · No. 43003
Coalition: PDT / PROS / PTB / PC do B / PSDC / PV

279Joao Muller342<0.01%
PRP · No. 44567
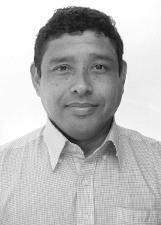
280Jorge Godinho da Silva325<0.01%
Alternate · SD · No. 77033
Coalition: PSB / PPS / PTC / PHS / PSL / PT do B / PRTB / PTN / SD

281Marcio Duarte318<0.01%
Alternate · PEN · No. 51515

282Adriano Santos317<0.01%
Alternate · PSL · No. 17123
Coalition: PSB / PPS / PTC / PHS / PSL / PT do B / PRTB / PTN / SD

283André Oliveira314<0.01%
Alternate · PPS · No. 23612
Coalition: PSB / PPS / PTC / PHS / PSL / PT do B / PRTB / PTN / SD
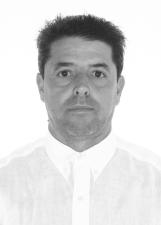
284Roberto Carlos312<0.01%
PRP · No. 44777
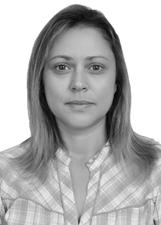
285Elis Rejane311<0.01%
Alternate · PSB · No. 40220
Coalition: PSB / PPS / PTC / PHS / PSL / PT do B / PRTB / PTN / SD
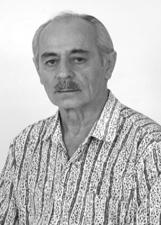
286Gasparino308<0.01%
PRP · No. 44244
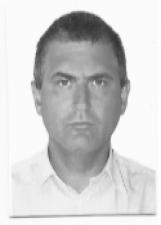
287Alexandre Leite300<0.01%
Alternate · PV · No. 43090
Coalition: PDT / PROS / PTB / PC do B / PSDC / PV

288Denny Souza284<0.01%
PSC · No. 20555
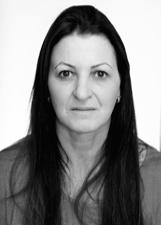
289Vivian Tamai269<0.01%
Alternate · PP · No. 11200

290Rudi Freitas260<0.01%
Alternate · PEN · No. 51234
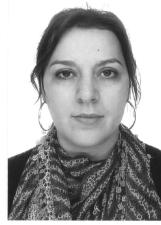
291Anna Sathler258<0.01%
PSC · No. 20778
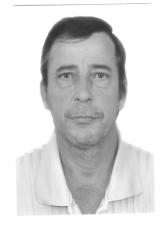
292Sérgio Machado257<0.01%
PSC · No. 20444
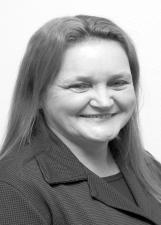
293Rosana Belé256<0.01%
PSOL · No. 50777
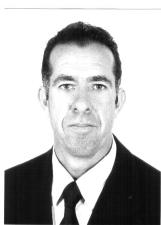
294Israel da Silva249<0.01%
PSC · No. 20500

295Roseli Geremia249<0.01%
PSOL · No. 50650
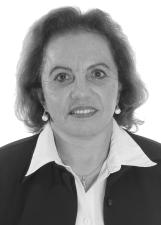
296Carmelina Barjona247<0.01%
Alternate · PP · No. 11022
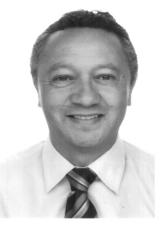
297Jorge Sampaio245<0.01%
PSC · No. 20064
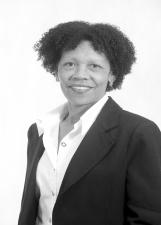
298Elsa Adão243<0.01%
PSOL · No. 50019
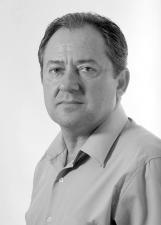
299João Ernesto Koch243<0.01%
PSOL · No. 50999
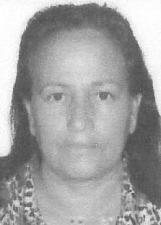
300Pastora Salete240<0.01%
Alternate · PTC · No. 36401
Coalition: PSB / PPS / PTC / PHS / PSL / PT do B / PRTB / PTN / SD
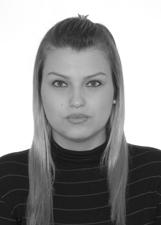
301Mariana Melo231<0.01%
PRP · No. 44124
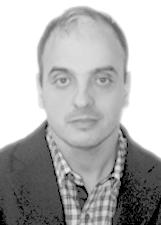
302Joãozinho230<0.01%
Alternate · PT do B · No. 70128
Coalition: PSB / PPS / PTC / PHS / PSL / PT do B / PRTB / PTN / SD
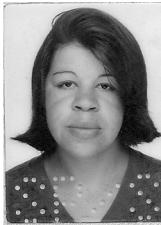
303Rose230<0.01%
PSC · No. 20472
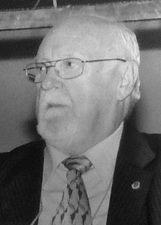
304Haroldo228<0.01%
Alternate · PT do B · No. 70455
Coalition: PSB / PPS / PTC / PHS / PSL / PT do B / PRTB / PTN / SD

305Rafael Pinguim227<0.01%
PPL · No. 54789
Coalition: PPL / PMN
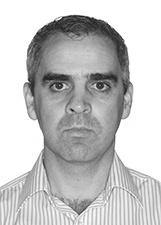
306Adriano de Liz226<0.01%
Alternate · PHS · No. 31222
Coalition: PSB / PPS / PTC / PHS / PSL / PT do B / PRTB / PTN / SD
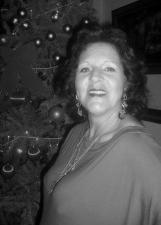
307Marlene Kjellin226<0.01%
PSC · No. 20047
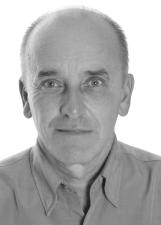
308Lino225<0.01%
Alternate · PT do B · No. 70888
Coalition: PSB / PPS / PTC / PHS / PSL / PT do B / PRTB / PTN / SD

309Karina Sinopoli222<0.01%
PRP · No. 44999
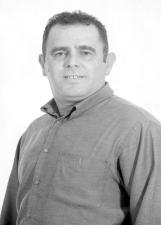
310Romário Campos217<0.01%
PSOL · No. 50145
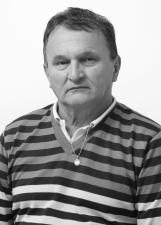
311Eto Coral216<0.01%
Alternate · PEN · No. 51333
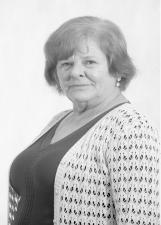
312Irone Falconi206<0.01%
PSOL · No. 50022
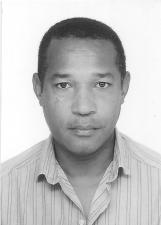
313Durval199<0.01%
PPL · No. 54320
Coalition: PPL / PMN
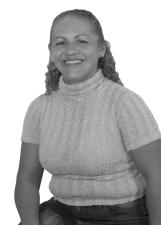
314Angelita Mateus195<0.01%
PSC · No. 20012
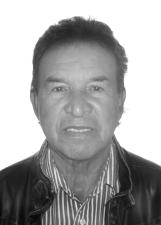
315Vilson Renato192<0.01%
Alternate · PSDC · No. 27777
Coalition: PDT / PROS / PTB / PC do B / PSDC / PV
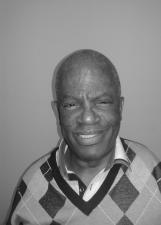
316Professor Juarez189<0.01%
PSC · No. 20069
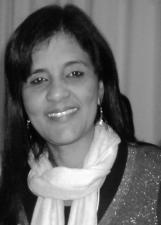
317Prof. Elizete189<0.01%
PSC · No. 20720
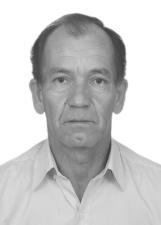
318Jose Eduardo186<0.01%
Alternate · PSL · No. 17000
Coalition: PSB / PPS / PTC / PHS / PSL / PT do B / PRTB / PTN / SD
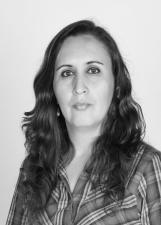
319Claudia Marinho185<0.01%
Alternate · PV · No. 43066
Coalition: PDT / PROS / PTB / PC do B / PSDC / PV

320Fossati184<0.01%
PSOL · No. 50550
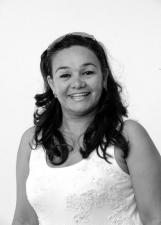
321Socorro Lisboa183<0.01%
Alternate · PPS · No. 23369
Coalition: PSB / PPS / PTC / PHS / PSL / PT do B / PRTB / PTN / SD
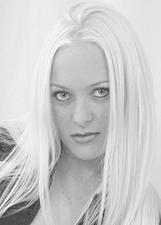
322Katiane Santos180<0.01%
Alternate · PTN · No. 19159
Coalition: PSB / PPS / PTC / PHS / PSL / PT do B / PRTB / PTN / SD
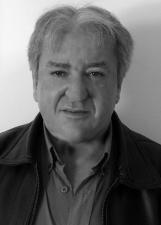
323Frank179<0.01%
PSC · No. 20001
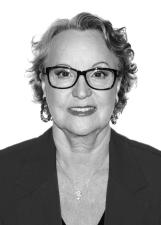
324Elaine Otto178<0.01%
Alternate · PPS · No. 23640
Coalition: PSB / PPS / PTC / PHS / PSL / PT do B / PRTB / PTN / SD

325Rônaldy Lemos177<0.01%
Alternate · PR · No. 22004
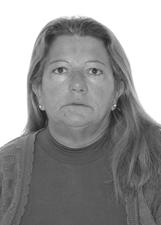
326Fátima Rabello176<0.01%
PRP · No. 44223
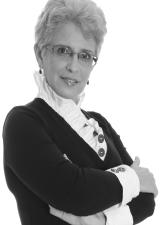
327Marcia Fernandes175<0.01%
PMN · No. 33123
Coalition: PPL / PMN
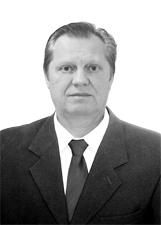
328Luiz Haveroth172<0.01%
PRP · No. 44044
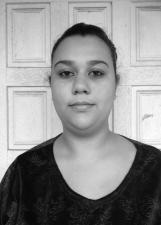
329Carmen164<0.01%
Alternate · PT do B · No. 70999
Coalition: PSB / PPS / PTC / PHS / PSL / PT do B / PRTB / PTN / SD
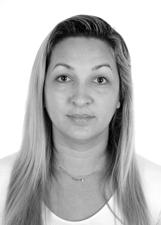
330Monica Bertolini163<0.01%
Alternate · PV · No. 43555
Coalition: PDT / PROS / PTB / PC do B / PSDC / PV
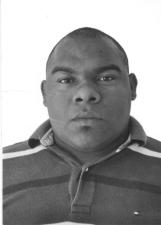
331Antonio Luiz161<0.01%
PSC · No. 20777

332Jasllana Villani161<0.01%
Alternate · PP · No. 11555
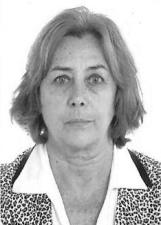
333Lourdes161<0.01%
Alternate · PPS · No. 23987
Coalition: PSB / PPS / PTC / PHS / PSL / PT do B / PRTB / PTN / SD
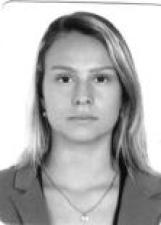
334Caroline Charao160<0.01%
Alternate · PRTB · No. 28028
Coalition: PSB / PPS / PTC / PHS / PSL / PT do B / PRTB / PTN / SD

335Marisa Hilbert160<0.01%
Alternate · DEM · No. 25000
Coalition: PSD / DEM / PMDB / PRB
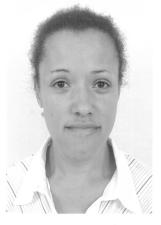
336Joana Angelita159<0.01%
Alternate · PT · No. 13200

337Salete Rocha154<0.01%
Alternate · PTC · No. 36036
Coalition: PSB / PPS / PTC / PHS / PSL / PT do B / PRTB / PTN / SD
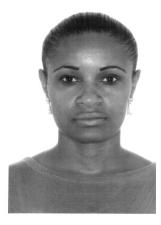
338Karina143<0.01%
PSC · No. 20110

339Anadia Novack132<0.01%
Alternate · PC do B · No. 65656
Coalition: PDT / PROS / PTB / PC do B / PSDC / PV
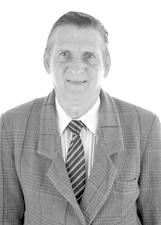
340Massocco131<0.01%
PPL · No. 54222
Coalition: PPL / PMN
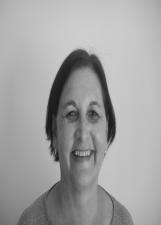
341Elin Ceryno130<0.01%
PSTU · No. 16123

342Sara Melo125<0.01%
Alternate · PT do B · No. 70456
Coalition: PSB / PPS / PTC / PHS / PSL / PT do B / PRTB / PTN / SD

343Isabel Doerner123<0.01%
Alternate · PRTB · No. 28123
Coalition: PSB / PPS / PTC / PHS / PSL / PT do B / PRTB / PTN / SD
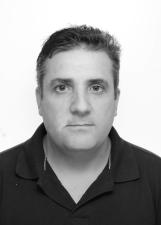
344Julio Caminha123<0.01%
PRP · No. 44245

345Rodrigo Marques da Rosa121<0.01%
Alternate · PEN · No. 51255
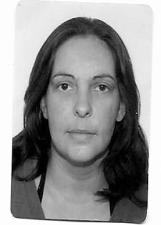
346Keli Oliveira120<0.01%
Alternate · PSDB · No. 45665
Coalition: PSDB / PATRIOTA
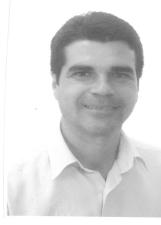
347Paulo Antunes120<0.01%
PSC · No. 20700

348Espirito Santo118<0.01%
PPL · No. 54321
Coalition: PPL / PMN
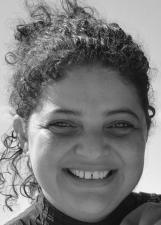
349Carolina Duarte Turco116<0.01%
PPL · No. 54000
Coalition: PPL / PMN

350Douglas Santellano114<0.01%
PSOL · No. 50456
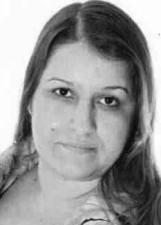
351Tatiane Reitz114<0.01%
Alternate · PTC · No. 36444
Coalition: PSB / PPS / PTC / PHS / PSL / PT do B / PRTB / PTN / SD
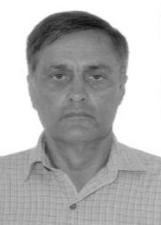
352França111<0.01%
Alternate · PPS · No. 23045
Coalition: PSB / PPS / PTC / PHS / PSL / PT do B / PRTB / PTN / SD

353Tevez Machado111<0.01%
Alternate · PEN · No. 51510

354Cláudia Nadal100<0.01%
Alternate · PP · No. 11444

355Jefferson Gizzi98<0.01%
PSOL · No. 50200
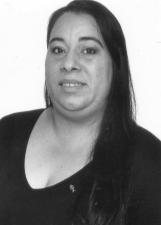
356Keila Farias98<0.01%
PSC · No. 20220
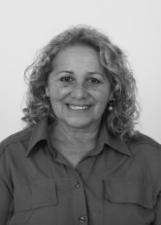
357Silvia Maria98<0.01%
Alternate · PP · No. 11000
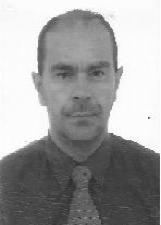
358Silvio Cesar Azevedo de Souza98<0.01%
Alternate · PHS · No. 31123
Coalition: PSB / PPS / PTC / PHS / PSL / PT do B / PRTB / PTN / SD
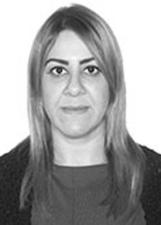
359Alessandra Sippel96<0.01%
PRP · No. 44222
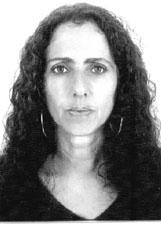
360Eliete93<0.01%
Alternate · PMDB · No. 15070
Coalition: PSD / DEM / PMDB / PRB
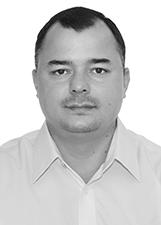
361Marcelo Vidal93<0.01%
Alternate · PEN · No. 51511

362Vanessa de Oliveira92<0.01%
PSOL · No. 50750

363Eliane Rodrigues87<0.01%
PSC · No. 20727
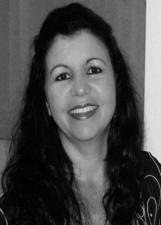
364Ana Maria81<0.01%
PSC · No. 20505
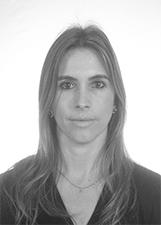
365Angelita72<0.01%
PRP · No. 44125
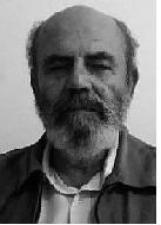
366Dr. Xixa71<0.01%
Alternate · PHS · No. 31333
Coalition: PSB / PPS / PTC / PHS / PSL / PT do B / PRTB / PTN / SD
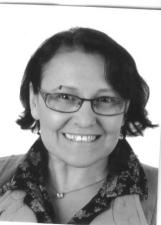
367Eliana Pontes71<0.01%
PSC · No. 20005
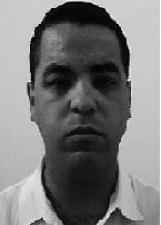
368Rogerio Cunha68<0.01%
Alternate · PHS · No. 31777
Coalition: PSB / PPS / PTC / PHS / PSL / PT do B / PRTB / PTN / SD
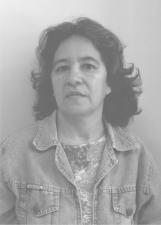
369Izabel63<0.01%
Alternate · PTC · No. 36333
Coalition: PSB / PPS / PTC / PHS / PSL / PT do B / PRTB / PTN / SD
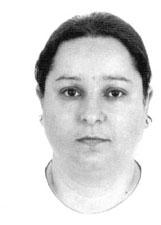
370Yara63<0.01%
Alternate · PMDB · No. 15834
Coalition: PSD / DEM / PMDB / PRB
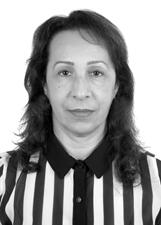
371Dra Guedes61<0.01%
Alternate · PP · No. 11477

372Vivian Flores dos Santos60<0.01%
Alternate · PDT · No. 12001
Coalition: PDT / PROS / PTB / PC do B / PSDC / PV
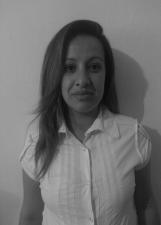
373Karin Cristina Camargo56<0.01%
Alternate · PDT · No. 12010
Coalition: PDT / PROS / PTB / PC do B / PSDC / PV
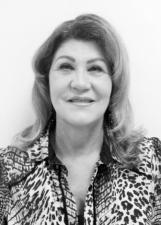
374Lau52<0.01%
Alternate · PSDB · No. 45673
Coalition: PSDB / PATRIOTA

375Thamiris49<0.01%
Alternate · PMDB · No. 15012
Coalition: PSD / DEM / PMDB / PRB

376Ivan Ferrari48<0.01%
PRP · No. 44007
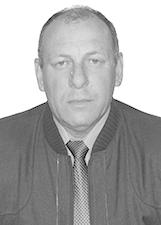
377J Rodrigues47<0.01%
Alternate · PEN · No. 51222
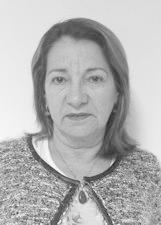
378Nara Bilhalva47<0.01%
Alternate · PP · No. 11110

379Rose Dioniz47<0.01%
PPL · No. 54013
Coalition: PPL / PMN
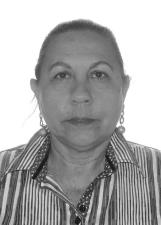
380Sonia Maria47<0.01%
Alternate · PT · No. 13910
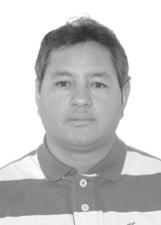
381Vanderlei Soares45<0.01%
PRP · No. 44776
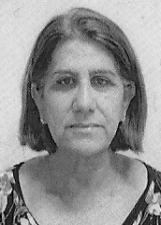
382Celoni42<0.01%
Alternate · PPS · No. 23122
Coalition: PSB / PPS / PTC / PHS / PSL / PT do B / PRTB / PTN / SD
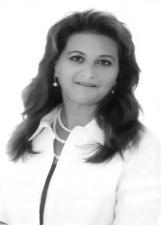
383Andrea Leal41<0.01%
Alternate · PR · No. 22484
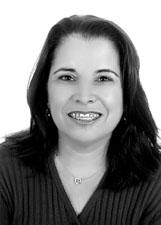
384Dinha38<0.01%
Alternate · PMDB · No. 15487
Coalition: PSD / DEM / PMDB / PRB
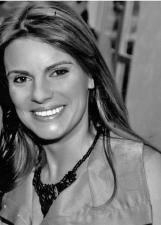
385Malu Mello28<0.01%
Alternate · PR · No. 22976
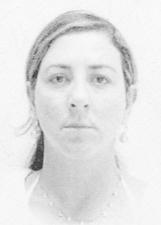
386Lucimar Nunes25<0.01%
Alternate · PTB · No. 14140
Coalition: PDT / PROS / PTB / PC do B / PSDC / PV
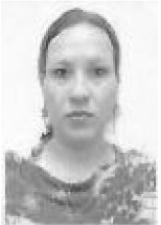
387Vanessa Witt25<0.01%
Alternate · PRTB · No. 28828
Coalition: PSB / PPS / PTC / PHS / PSL / PT do B / PRTB / PTN / SD
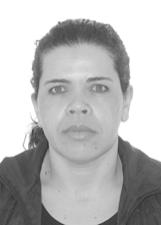
388Veralucia25<0.01%
PRP · No. 44144
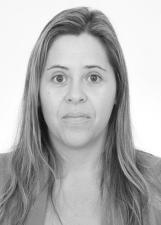
389Karina Gonçalves24<0.01%
Alternate · PPS · No. 23567
Coalition: PSB / PPS / PTC / PHS / PSL / PT do B / PRTB / PTN / SD
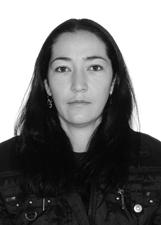
390Fernanda Torres20<0.01%
PRP · No. 44344
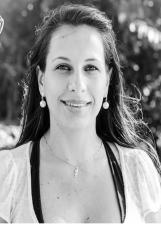
391Tamyris Zeferino19<0.01%
Alternate · PR · No. 22815
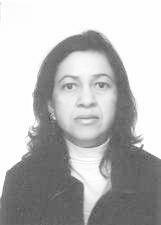
392Elena Giangareli18<0.01%
Alternate · PRTB · No. 28080
Coalition: PSB / PPS / PTC / PHS / PSL / PT do B / PRTB / PTN / SD

393Elisane Marcos de Farias12<0.01%
Alternate · DEM · No. 25640
Coalition: PSD / DEM / PMDB / PRB
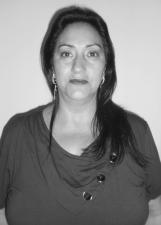
394Teresinha Zanella12<0.01%
Alternate · PR · No. 22171

395Lucia Veríssimo9<0.01%
Alternate · PP · No. 11986
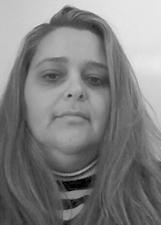
396Glaucia Aguiar5<0.01%
Alternate · PR · No. 22793
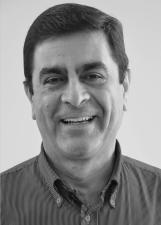
—Dagomar Carneiro10,491
Outside the TSE count · PSB · No. 40000
Coalition: PSB / PPS / PTC / PHS / PSL / PT do B / PRTB / PTN / SD
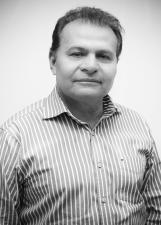
—Gilmar Knaesel749
Outside the TSE count · PSDB · No. 45222
Coalition: PSDB / PATRIOTA
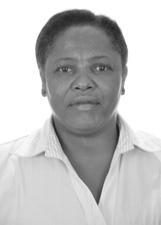
—Janete da Conceição521
Annulled votesIneligible to run · PRP · No. 44333

—Marcelo Bolsoni307
Annulled votesIneligible to run · PRP · No. 44122

—Alessandro Simas193
Annulled votesIneligible to run · PR · No. 22622
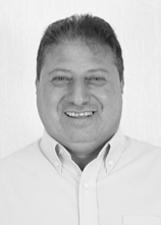
—Elbio Boldori158
Annulled votesIneligible to run · PRP · No. 44321
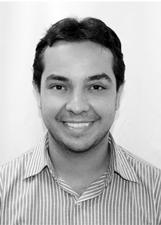
—Victor Hugo118
Annulled votesIneligible to run · PRP · No. 44414

—Edemar Ratkiewicz115
Annulled votesIneligible to run · PRP · No. 44001
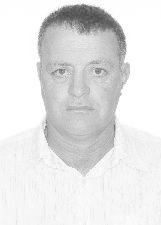
—Guaresi65
Annulled votesIneligible to run · PR · No. 22280

—Lucas Doleski37
Annulled votesIneligible to run · PRP · No. 44464

—Rezende35
Annulled votesIneligible to run · PSDB · No. 45198
Coalition: PSDB / PATRIOTA
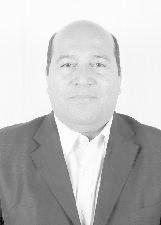
—Marco Rodrigues25
Annulled votesIneligible to run · PHS · No. 31234
Coalition: PSB / PPS / PTC / PHS / PSL / PT do B / PRTB / PTN / SD
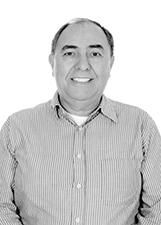
—Jose Martins9
Annulled votesIneligible to run · PRP · No. 44700


