In 2014, in Amapá, 24 state deputies were elected, according to data from Brazil's Superior Electoral Court (TSE). The largest caucus was that of PRB (4). The most votes went to Marilia Góes (PDT), with 11,747 votes (2.99% of the valid votes). The electoral quotient was about 16,382 votes, and the lowest vote total among those elected was 4,105: seats are allocated to the party first.

1Marilia Góes11,7472.99%
Elected · PDT · No. 12123
Coalition: PP / PDT / PMDB

2Dr. Furlan8,9472.28%
Elected · PTB · No. 14000
Coalition: PTB / PPS / PRTB / PMN / PTC / PPL

3Michel Jk8,6792.21%
Elected · PSDB · No. 45123
Coalition: DEM / PSDB / SD / PSD
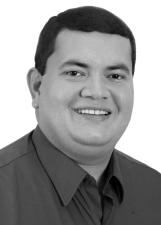
4Junior Favacho7,1871.83%
Elected · PMDB · No. 15699
Coalition: PP / PDT / PMDB
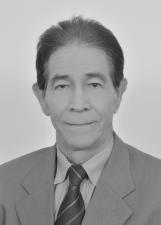
5Dr.jaci6,9651.77%
Elected · PROS · No. 90100
Coalition: PROS / PV / PSDC / PATRIOTA
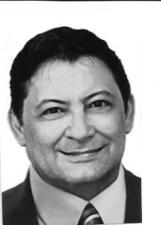
6Max da Aabb6,6671.70%
Elected · PSB · No. 40222
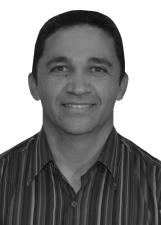
7Pastor Oliveira6,4861.65%
Elected · PRB · No. 10147
Coalition: PR / PRB / PHS
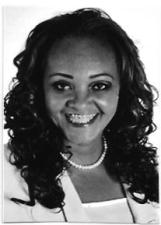
8Cristina Almeida5,8831.50%
Elected · PSB · No. 40789

9Augusto Aguiar5,8031.48%
Elected · PMDB · No. 15123
Coalition: PP / PDT / PMDB

10Jory Oeiras5,7211.46%
Elected · PRB · No. 10300
Coalition: PR / PRB / PHS

11Charles Marques5,7041.45%
Elected · PSDC · No. 27147
Coalition: PROS / PV / PSDC / PATRIOTA

12Mira Rocha5,6541.44%
Elected · PTB · No. 14122
Coalition: PTB / PPS / PRTB / PMN / PTC / PPL
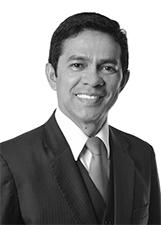
13Ericlaudio5,6161.43%
Elected · PRB · No. 10116
Coalition: PR / PRB / PHS

14Roseli5,4801.39%
Elected · DEM · No. 25456
Coalition: DEM / PSDB / SD / PSD

15Haroldo Abdon da Topfiat5,4451.38%
Alternate · PPL · No. 54123
Coalition: PTB / PPS / PRTB / PMN / PTC / PPL
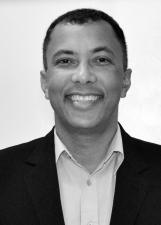
16Jaime Perez5,3601.36%
Elected · PRB · No. 10456
Coalition: PR / PRB / PHS

17Luciana5,1461.31%
Elected (remainder seat) · PHS · No. 31123
Coalition: PR / PRB / PHS

18Moises Souza5,1111.30%
Elected · PSC · No. 20123

19Edna Auzier5,0581.29%
Elected (remainder seat) · PROS · No. 90369
Coalition: PROS / PV / PSDC / PATRIOTA
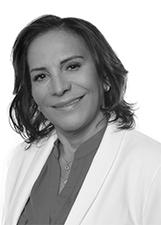
20Maria Góes5,0281.28%
Elected (remainder seat) · PDT · No. 12111
Coalition: PP / PDT / PMDB
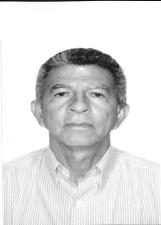
21Jorge Souza4,9971.27%
Alternate · PSB · No. 40122

22João de Deus4,9751.27%
Alternate · PSDC · No. 27444
Coalition: PROS / PV / PSDC / PATRIOTA
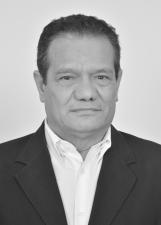
23Zeze Nunes4,9391.26%
Alternate · PV · No. 43123
Coalition: PROS / PV / PSDC / PATRIOTA

24Valdeco4,9381.26%
Alternate · PROS · No. 90123
Coalition: PROS / PV / PSDC / PATRIOTA
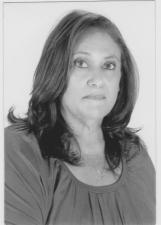
25Raimunda Beirão4,8731.24%
Elected · PSDB · No. 45678
Coalition: DEM / PSDB / SD / PSD

26Kaká4,8431.23%
Elected · PT do B · No. 70369
Coalition: PT do B / PTN
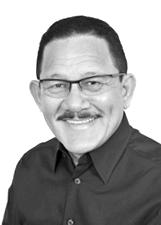
27Edinho Duarte4,7471.21%
Alternate · PP · No. 11111
Coalition: PP / PDT / PMDB
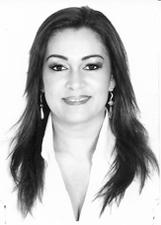
28Sandra Ohana4,6811.19%
Alternate · PP · No. 11000
Coalition: PP / PDT / PMDB

29Balieiro4,6351.18%
Alternate · PSB · No. 40190
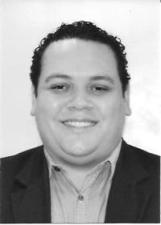
30Allan Ramalho4,5821.17%
Alternate · PSB · No. 40111

31Marcio Serrão4,5401.15%
Alternate · PRB · No. 10000
Coalition: PR / PRB / PHS
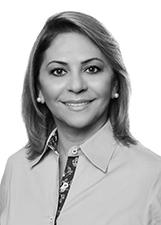
32Telma Gurgel4,4721.14%
Alternate · PRB · No. 10123
Coalition: PR / PRB / PHS

33Dr. Brasil4,4631.14%
Alternate · PTN · No. 19123
Coalition: PT do B / PTN

34Fabricio Furlan4,2941.09%
Elected · PSOL · No. 50000
Coalition: PSOL / PT / PC do B
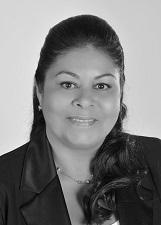
35Aparecida Salomão4,2881.09%
Alternate · PSD · No. 55789
Coalition: DEM / PSDB / SD / PSD

36Pedro da Lua4,1681.06%
Elected (remainder seat) · PSC · No. 20800

37Keka Cantuaria4,1281.05%
Alternate · PDT · No. 12345
Coalition: PP / PDT / PMDB
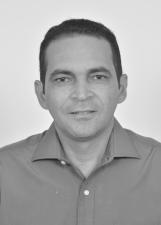
38Professor Paulo Lemos4,1051.04%
Elected · PSOL · No. 50123
Coalition: PSOL / PT / PC do B

39Isaac Alcolumbre3,9431.00%
Alternate · DEM · No. 25123
Coalition: DEM / PSDB / SD / PSD

40Washington3,8710.98%
Alternate · PSB · No. 40123

41Israel Jr3,6920.94%
Alternate · PR · No. 22580
Coalition: PR / PRB / PHS

42Dalto3,6870.94%
Alternate · PMDB · No. 15789
Coalition: PP / PDT / PMDB
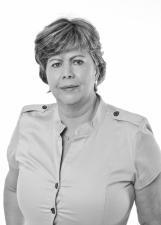
43Janete Tavares3,5780.91%
Alternate · PSC · No. 20120

44Marcio Sacramento3,5060.89%
Alternate · PRB · No. 10580
Coalition: PR / PRB / PHS

45Arrá Moreno3,4630.88%
Alternate · PHS · No. 31031
Coalition: PR / PRB / PHS
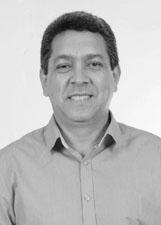
46Pingarilho3,3260.85%
Alternate · PC do B · No. 65123
Coalition: PSOL / PT / PC do B

47Joel Banha3,2770.83%
Alternate · PT · No. 13580
Coalition: PSOL / PT / PC do B

48Maria Teresa3,2350.82%
Alternate · DEM · No. 25111
Coalition: DEM / PSDB / SD / PSD

49Paulinho Ramos3,2300.82%
Alternate · PRTB · No. 28999
Coalition: PTB / PPS / PRTB / PMN / PTC / PPL

50Ruzivan Pontes3,2250.82%
Alternate · SD · No. 77123
Coalition: DEM / PSDB / SD / PSD
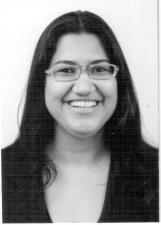
51Isabel Nogueira3,2050.82%
Alternate · PT · No. 13123
Coalition: PSOL / PT / PC do B

52Koka2,8330.72%
Alternate · PT do B · No. 70000
Coalition: PT do B / PTN

53Alan Cristophe2,7750.71%
Alternate · PR · No. 22123
Coalition: PR / PRB / PHS
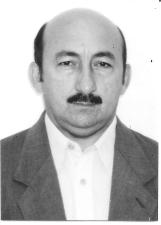
54Pr. Eliá Conrado2,7030.69%
PRP · No. 44555

55Bruno Santos2,6990.69%
Alternate · PSDB · No. 45369
Coalition: DEM / PSDB / SD / PSD

56Adail Jr.2,5000.64%
Alternate · PT do B · No. 70123
Coalition: PT do B / PTN
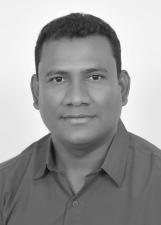
57Zé Roberto2,4930.63%
Alternate · PT · No. 13013
Coalition: PSOL / PT / PC do B

58Lucenira Pimentel2,4670.63%
Alternate · PR · No. 22000
Coalition: PR / PRB / PHS

59Ameliany Azevedo2,4410.62%
Alternate · PSC · No. 20777

60Paulão2,4120.61%
Alternate · PT · No. 13000
Coalition: PSOL / PT / PC do B

61Professor Madeira2,3100.59%
Alternate · PSOL · No. 50050
Coalition: PSOL / PT / PC do B

62Kassyo2,2450.57%
Alternate · PSC · No. 20020
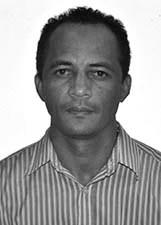
63R. Nelson2,2020.56%
Alternate · PRB · No. 10193
Coalition: PR / PRB / PHS

64Venicio da Real Catálogo2,1330.54%
Alternate · PSB · No. 40140

65Anab Monteiro1,9010.48%
Alternate · PSC · No. 20369

66Professora Helena1,8040.46%
Alternate · PSDC · No. 27123
Coalition: PROS / PV / PSDC / PATRIOTA

67Didio Silva1,7350.44%
Alternate · PSC · No. 20220

68Ester de Paula1,7070.43%
Alternate · SD · No. 77777
Coalition: DEM / PSDB / SD / PSD
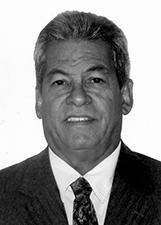
69Tupan1,6930.43%
Alternate · PMDB · No. 15198
Coalition: PP / PDT / PMDB
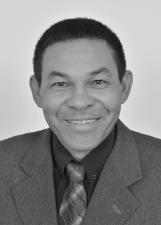
70Juscelino Fernandes1,6540.42%
Alternate · PDT · No. 12500
Coalition: PP / PDT / PMDB
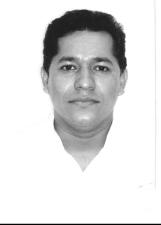
71Malafaia1,5890.40%
Alternate · PSOL · No. 50500
Coalition: PSOL / PT / PC do B
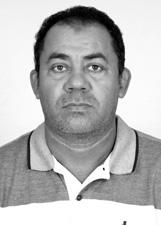
72Prof Almiro Abreu1,5520.39%
Alternate · PSD · No. 55655
Coalition: DEM / PSDB / SD / PSD
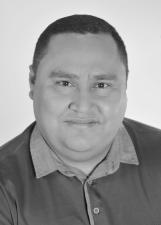
73Banha Lobato1,5260.39%
Alternate · PRTB · No. 28123
Coalition: PTB / PPS / PRTB / PMN / PTC / PPL

74Edmilson Birimbal1,5150.39%
Alternate · PR · No. 22456
Coalition: PR / PRB / PHS
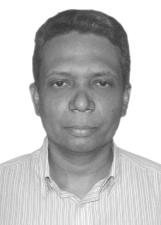
75Petrus Ramos1,5110.38%
Alternate · PR · No. 22222
Coalition: PR / PRB / PHS

76Alexandre Barcelos1,4880.38%
Alternate · PSC · No. 20200
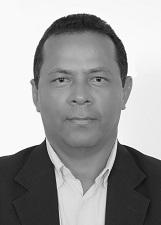
77Ronilson Barriga1,4630.37%
Alternate · DEM · No. 25800
Coalition: DEM / PSDB / SD / PSD
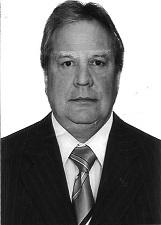
78Grott1,4510.37%
Alternate · PSD · No. 55100
Coalition: DEM / PSDB / SD / PSD
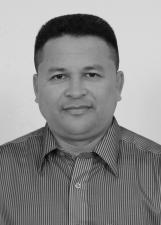
79Saraiva1,3950.35%
Alternate · PRB · No. 10800
Coalition: PR / PRB / PHS
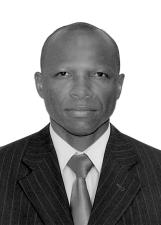
80Jorginho Maciel1,3390.34%
Alternate · PSOL · No. 50192
Coalition: PSOL / PT / PC do B
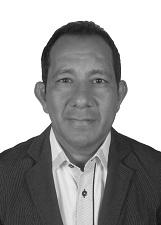
81Adelson de Rocha1,3180.34%
Alternate · PSD · No. 55000
Coalition: DEM / PSDB / SD / PSD

82Cafu Rabelo1,3150.33%
PRP · No. 44123
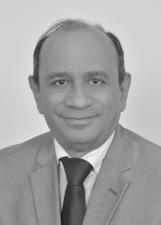
83Jorge Salomao1,2900.33%
Alternate · PROS · No. 90122
Coalition: PROS / PV / PSDC / PATRIOTA
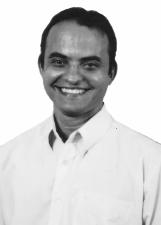
84Reinaldo Portilho1,2310.31%
Alternate · PHS · No. 31369
Coalition: PR / PRB / PHS
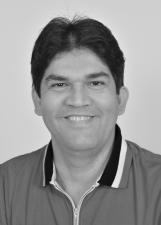
85Professor Elias1,2280.31%
Alternate · PV · No. 43000
Coalition: PROS / PV / PSDC / PATRIOTA
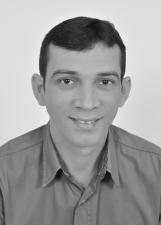
86Sérgio Abreu1,2250.31%
Alternate · PMDB · No. 15888
Coalition: PP / PDT / PMDB
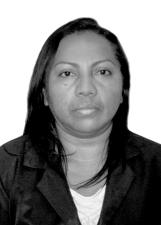
87Eclemilda1,2080.31%
Alternate · PDT · No. 12122
Coalition: PP / PDT / PMDB

88Altair1,1970.30%
Alternate · PRB · No. 10500
Coalition: PR / PRB / PHS

89Denilson Brito1,1610.30%
Alternate · PPS · No. 23321
Coalition: PTB / PPS / PRTB / PMN / PTC / PPL
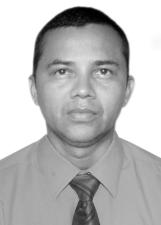
90Paulinho Vigilante1,1590.29%
Alternate · PSOL · No. 50999
Coalition: PSOL / PT / PC do B
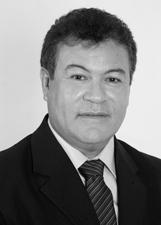
91Washington Caldas1,1570.29%
Alternate · PP · No. 11222
Coalition: PP / PDT / PMDB

92Helena Guerra1,0860.28%
Alternate · PRB · No. 10789
Coalition: PR / PRB / PHS
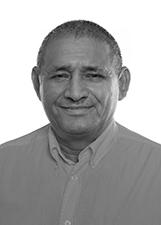
93Edvaldo Pena1,0140.26%
Alternate · PSDB · No. 45000
Coalition: DEM / PSDB / SD / PSD

94Tom Sobral9530.24%
Alternate · PSOL · No. 50789
Coalition: PSOL / PT / PC do B
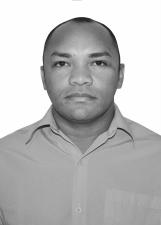
95Professor Domingos Silva9010.23%
Alternate · PSC · No. 20456
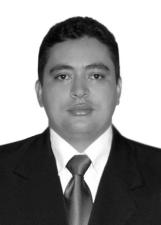
96Ailton Costa8960.23%
PSTU · No. 16123

97Rafael Gatinho8330.21%
Alternate · PRB · No. 10159
Coalition: PR / PRB / PHS
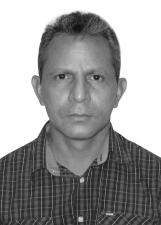
98Professor Xavier8230.21%
Alternate · PHS · No. 31789
Coalition: PR / PRB / PHS
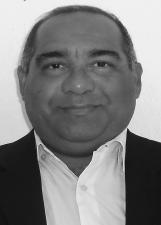
99Professor Besaliel7990.20%
PRP · No. 44369

100Marcelo Mesquita7710.20%
Alternate · PSC · No. 20888

101Aureliano7450.19%
Alternate · PRB · No. 10555
Coalition: PR / PRB / PHS

102Mana Neiva7290.19%
Alternate · PSC · No. 20000

103Carol Lopes6470.16%
Alternate · PROS · No. 90000
Coalition: PROS / PV / PSDC / PATRIOTA
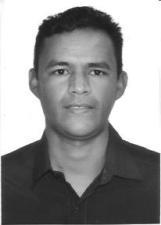
104Aldo Oliveira6130.16%
Alternate · PSB · No. 40333
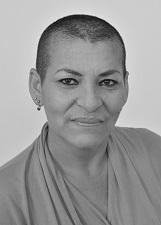
105Suzana Machado6020.15%
Alternate · PSD · No. 55222
Coalition: DEM / PSDB / SD / PSD

106Manoel do Zerão6000.15%
Alternate · PPS · No. 23444
Coalition: PTB / PPS / PRTB / PMN / PTC / PPL
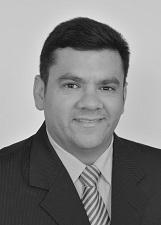
107Yuri Bezerra5930.15%
Alternate · DEM · No. 25369
Coalition: DEM / PSDB / SD / PSD

108Ribamar Rodrigues5850.15%
Alternate · PEN · No. 51234
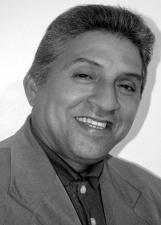
109Pastor Júlio Batista5790.15%
PRP · No. 44321
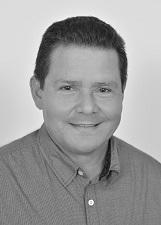
110Bit5710.15%
Alternate · DEM · No. 25100
Coalition: DEM / PSDB / SD / PSD

111Marcelo Creão5650.14%
Alternate · PDT · No. 12333
Coalition: PP / PDT / PMDB

112Antonia Cardoso5620.14%
Alternate · PPS · No. 23580
Coalition: PTB / PPS / PRTB / PMN / PTC / PPL
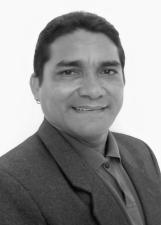
113Jackson Amaral5460.14%
Alternate · PPS · No. 23147
Coalition: PTB / PPS / PRTB / PMN / PTC / PPL
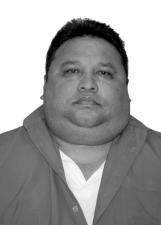
114Apostolo Santana5410.14%
Alternate · PC do B · No. 65147
Coalition: PSOL / PT / PC do B

115Didi5360.14%
Alternate · PR · No. 22888
Coalition: PR / PRB / PHS
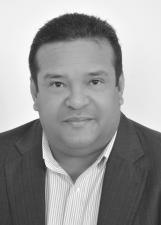
116Luis Trindade5360.14%
Alternate · PRTB · No. 28000
Coalition: PTB / PPS / PRTB / PMN / PTC / PPL
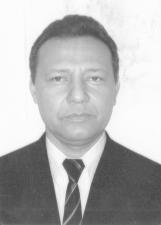
117Cirilo5310.14%
Alternate · PPS · No. 23699
Coalition: PTB / PPS / PRTB / PMN / PTC / PPL
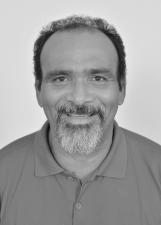
118Gilvan Mira5300.13%
Alternate · PTN · No. 19789
Coalition: PT do B / PTN
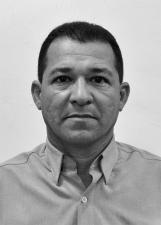
119Lindemberg O Ceara5180.13%
Alternate · PPS · No. 23246
Coalition: PTB / PPS / PRTB / PMN / PTC / PPL
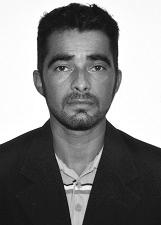
120Klênio5100.13%
Alternate · PSD · No. 55112
Coalition: DEM / PSDB / SD / PSD

121Alan Santos5030.13%
Alternate · PT · No. 13999
Coalition: PSOL / PT / PC do B
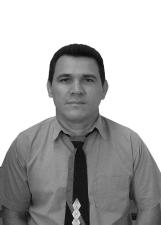
122Lima Junior4940.13%
Alternate · PRB · No. 10933
Coalition: PR / PRB / PHS
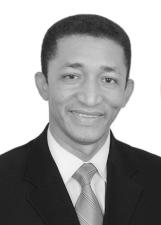
123Ailton Dias Belo4700.12%
Alternate · PT do B · No. 70569
Coalition: PT do B / PTN

124Pastor Nunes4350.11%
Alternate · PR · No. 22345
Coalition: PR / PRB / PHS
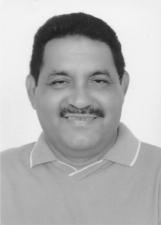
125Major Alcides4340.11%
Alternate · PSC · No. 20190

126Paulo Eduardo4200.11%
Alternate · PV · No. 43456
Coalition: PROS / PV / PSDC / PATRIOTA
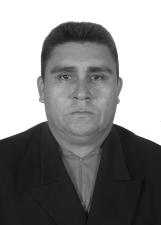
127Carlos da Cerpa4150.11%
Alternate · PSOL · No. 50147
Coalition: PSOL / PT / PC do B

128Tiago Paiva4110.10%
Alternate · PSOL · No. 50111
Coalition: PSOL / PT / PC do B
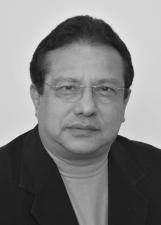
129Dr. Eduardo Costa4050.10%
Alternate · PRTB · No. 28789
Coalition: PTB / PPS / PRTB / PMN / PTC / PPL
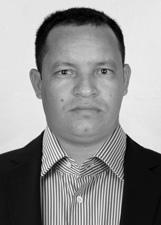
130Naldo Bezerra3990.10%
Alternate · PSOL · No. 50400
Coalition: PSOL / PT / PC do B

131Lane3900.10%
Alternate · PDT · No. 12369
Coalition: PP / PDT / PMDB
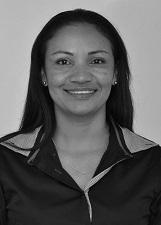
132Fernanda Silva3870.10%
Alternate · PSD · No. 55123
Coalition: DEM / PSDB / SD / PSD
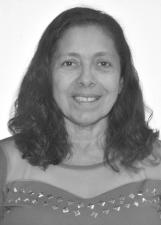
133Valda3860.10%
Alternate · PPS · No. 23111
Coalition: PTB / PPS / PRTB / PMN / PTC / PPL
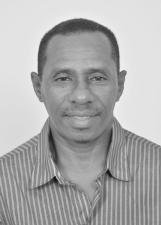
134Josiel Lima3810.10%
Alternate · PPS · No. 23123
Coalition: PTB / PPS / PRTB / PMN / PTC / PPL
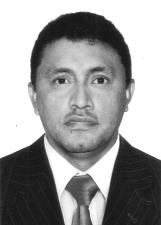
135Irmão Alexandre3760.10%
PRP · No. 44147
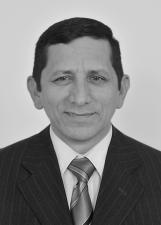
136Pery do Sindicato3710.09%
Alternate · PV · No. 43100
Coalition: PROS / PV / PSDC / PATRIOTA
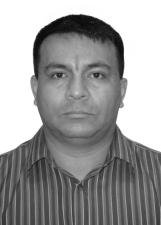
137Codó Piapau3700.09%
Alternate · PRTB · No. 28800
Coalition: PTB / PPS / PRTB / PMN / PTC / PPL
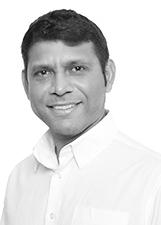
138Gino Quintela3680.09%
Alternate · PSOL · No. 50478
Coalition: PSOL / PT / PC do B
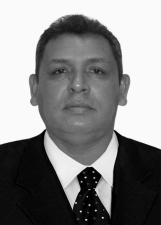
139Sargento Raildo3680.09%
Alternate · PR · No. 22190
Coalition: PR / PRB / PHS
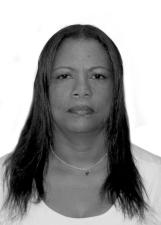
140Pastora Maria de Jesus3430.09%
Alternate · PP · No. 11368
Coalition: PP / PDT / PMDB

141Zé Galinha3310.08%
Alternate · PR · No. 22111
Coalition: PR / PRB / PHS

142Patricia Cardoso3290.08%
Alternate · PSC · No. 20015
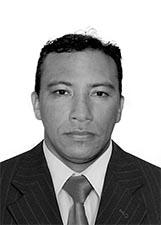
143Tubarã03240.08%
Alternate · PC do B · No. 65555
Coalition: PSOL / PT / PC do B
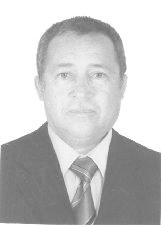
144Pequinês3200.08%
Alternate · PPS · No. 23369
Coalition: PTB / PPS / PRTB / PMN / PTC / PPL
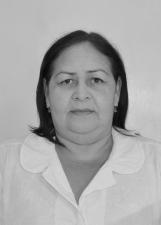
145Professora Noêmia3200.08%
Alternate · PHS · No. 31580
Coalition: PR / PRB / PHS
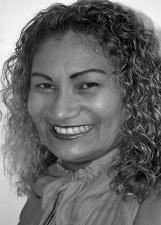
146Mirel3150.08%
PRP · No. 44744

147Gigi da Caçamba3040.08%
Alternate · PPS · No. 23100
Coalition: PTB / PPS / PRTB / PMN / PTC / PPL
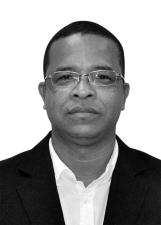
148Edmundo Leão3000.08%
Alternate · PT · No. 13258
Coalition: PSOL / PT / PC do B
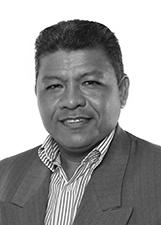
149Pr. Cícero2980.08%
Alternate · PSDB · No. 45777
Coalition: DEM / PSDB / SD / PSD
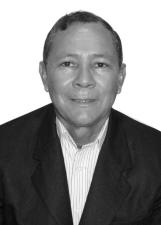
150Manoel Macedo2970.08%
Alternate · PPS · No. 23888
Coalition: PTB / PPS / PRTB / PMN / PTC / PPL
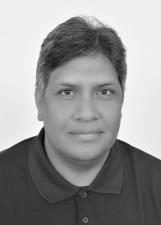
151Wene Valente2950.08%
Alternate · PRTB · No. 28555
Coalition: PTB / PPS / PRTB / PMN / PTC / PPL
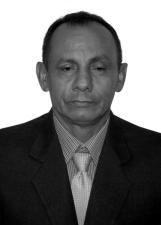
152Paulinho Pelo Social2940.07%
Alternate · PR · No. 22007
Coalition: PR / PRB / PHS
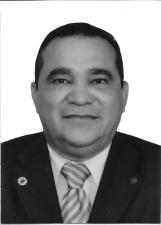
153Martel Agra2890.07%
Alternate · PSB · No. 40100
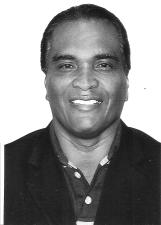
154Cantor Ronaldo Costa2800.07%
PRP · No. 44789

155Antonio Viana2740.07%
Alternate · PT do B · No. 70999
Coalition: PT do B / PTN
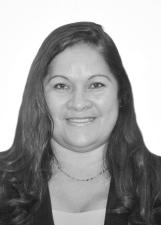
156Joeva Reis2730.07%
Alternate · PSB · No. 40444
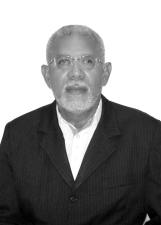
157Professor Fernando Rodrigues2670.07%
Alternate · PSC · No. 20111
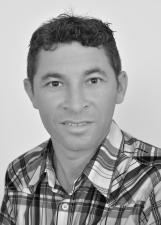
158Louro de Santana2660.07%
Alternate · PRTB · No. 28456
Coalition: PTB / PPS / PRTB / PMN / PTC / PPL
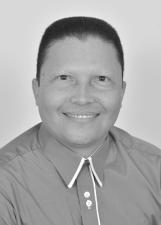
159Adielson Viegas2650.07%
Alternate · PSC · No. 20300
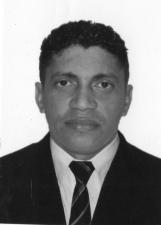
160Carlos Andre2640.07%
Alternate · PPS · No. 23222
Coalition: PTB / PPS / PRTB / PMN / PTC / PPL
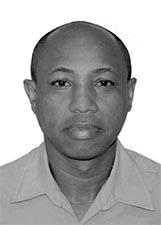
161Claudio Chaves2560.07%
Alternate · PC do B · No. 65100
Coalition: PSOL / PT / PC do B
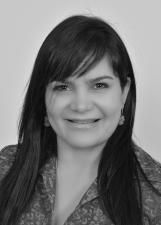
162Ieda2510.06%
Alternate · PSOL · No. 50321
Coalition: PSOL / PT / PC do B

163Engenheiro Espindola2500.06%
Alternate · PSOL · No. 50246
Coalition: PSOL / PT / PC do B
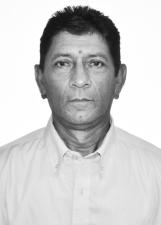
164Aldo Brito2460.06%
Alternate · PSC · No. 20100

165Dina2450.06%
Alternate · PSOL · No. 50555
Coalition: PSOL / PT / PC do B
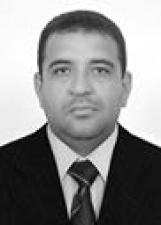
166Prof.. Geoval2320.06%
Alternate · PTC · No. 36369
Coalition: PTB / PPS / PRTB / PMN / PTC / PPL
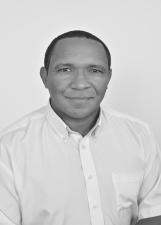
167Tenente Palmerim2300.06%
Alternate · PSD · No. 55190
Coalition: DEM / PSDB / SD / PSD

168Iva Mercês2240.06%
Alternate · PT do B · No. 70456
Coalition: PT do B / PTN
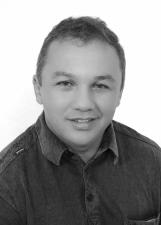
169Xororo2200.06%
Alternate · PDT · No. 12112
Coalition: PP / PDT / PMDB
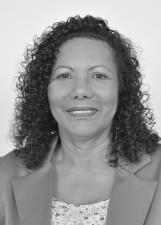
170Deuza Saúde2190.06%
Alternate · PEN · No. 51551

171Acenildo Costa2180.06%
Alternate · PR · No. 22700
Coalition: PR / PRB / PHS

172Cleide Regina2150.05%
Alternate · PV · No. 43333
Coalition: PROS / PV / PSDC / PATRIOTA
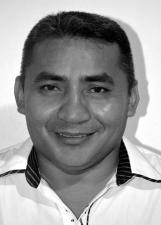
173Prof. Paulo Brito2110.05%
PRP · No. 44445

174Toni Gonçalves2050.05%
Alternate · PDT · No. 12012
Coalition: PP / PDT / PMDB
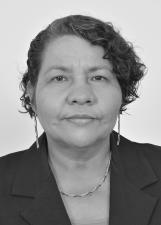
175Marta Lucia2020.05%
Alternate · PPS · No. 23777
Coalition: PTB / PPS / PRTB / PMN / PTC / PPL
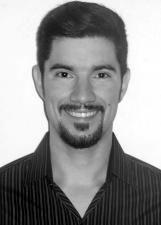
176Isaque1960.05%
PRP · No. 44111
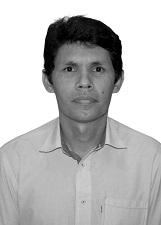
177Fernando da Gama1950.05%
Alternate · PSD · No. 55444
Coalition: DEM / PSDB / SD / PSD
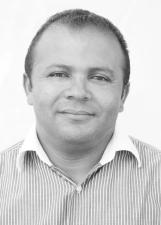
178Manoelzinho do Cd1910.05%
Alternate · PR · No. 22369
Coalition: PR / PRB / PHS

179Ricardo Pereira1900.05%
Alternate · PROS · No. 90112
Coalition: PROS / PV / PSDC / PATRIOTA
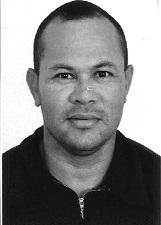
180Sorveteiro Amigo1890.05%
Alternate · DEM · No. 25007
Coalition: DEM / PSDB / SD / PSD

181Carioca1810.05%
Alternate · PSC · No. 20333
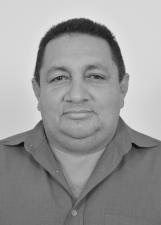
182Riba do PSOL1810.05%
Alternate · PSOL · No. 50200
Coalition: PSOL / PT / PC do B
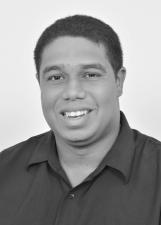
183Kleiton Farias1730.04%
Alternate · PEN · No. 51321
184Camões1670.04%
Alternate · PDT · No. 12555
Coalition: PP / PDT / PMDB

185Edú Tavares1670.04%
Alternate · PT do B · No. 70190
Coalition: PT do B / PTN

186Rogério Luz1660.04%
Alternate · PHS · No. 31333
Coalition: PR / PRB / PHS
187Adervan1640.04%
Alternate · PSC · No. 20360

188Vera Benício1600.04%
Alternate · PT do B · No. 70247
Coalition: PT do B / PTN
189Delmarabaixo1550.04%
Alternate · PHS · No. 31456
Coalition: PR / PRB / PHS
190Edson Alves1550.04%
Alternate · PSC · No. 20147

191Emival Junior1520.04%
Alternate · PSC · No. 20321
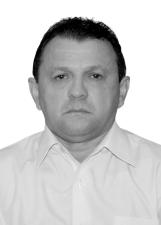
192Tupinambá1500.04%
Alternate · PSC · No. 20222
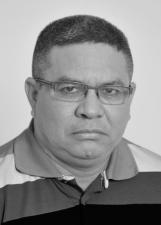
193Calos Cardoso1460.04%
Alternate · PRTB · No. 28190
Coalition: PTB / PPS / PRTB / PMN / PTC / PPL
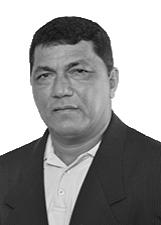
194Juvenil Jj1450.04%
Alternate · PSDB · No. 45200
Coalition: DEM / PSDB / SD / PSD

195Mônica Rocha1450.04%
Alternate · PRB · No. 10699
Coalition: PR / PRB / PHS
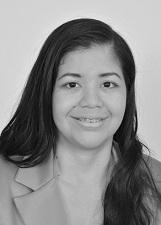
196Narinha, Missionaria Nara1450.04%
Alternate · DEM · No. 25852
Coalition: DEM / PSDB / SD / PSD
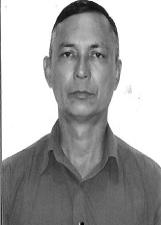
197Tenente Ronaldo1450.04%
Alternate · PSD · No. 55127
Coalition: DEM / PSDB / SD / PSD

198Coronel Maria Sousa1430.04%
PRP · No. 44144
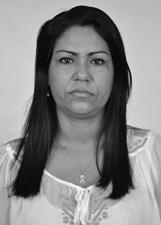
199Bilú Monteiro1420.04%
Alternate · PPS · No. 23180
Coalition: PTB / PPS / PRTB / PMN / PTC / PPL
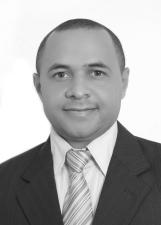
200Markinho1380.04%
Alternate · PR · No. 22096
Coalition: PR / PRB / PHS
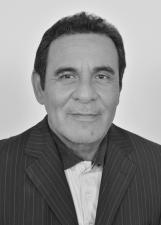
201Chico Meu Irmão1370.03%
Alternate · PTC · No. 36117
Coalition: PTB / PPS / PRTB / PMN / PTC / PPL
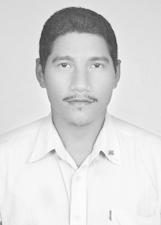
202O Amigo José1370.03%
Alternate · SD · No. 77333
Coalition: DEM / PSDB / SD / PSD
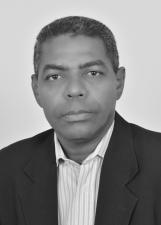
203Paulo Figueredo1360.03%
Alternate · PT do B · No. 70321
Coalition: PT do B / PTN
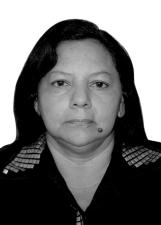
204Lindomar1330.03%
Alternate · PTN · No. 19357
Coalition: PT do B / PTN
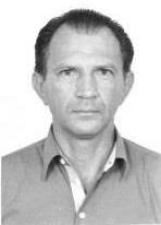
205Prof.. Judson Barros1330.03%
Alternate · PMN · No. 33123
Coalition: PTB / PPS / PRTB / PMN / PTC / PPL
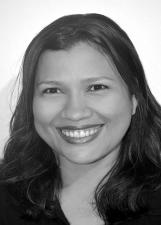
206Professora Emy1310.03%
PRP · No. 44777

207Deuza Dias1300.03%
Alternate · PTN · No. 19125
Coalition: PT do B / PTN
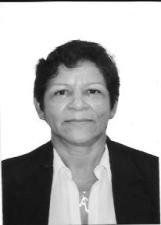
208Alda1240.03%
Alternate · PSB · No. 40013

209Ricardo Costa1230.03%
Alternate · PSDC · No. 27277
Coalition: PROS / PV / PSDC / PATRIOTA
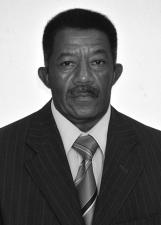
210Antenor1200.03%
Alternate · PTN · No. 19019
Coalition: PT do B / PTN
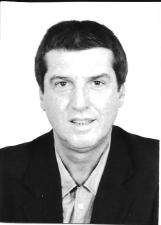
211Claudio Baptistão1160.03%
Alternate · PSB · No. 40401

212Prof. Fatima Soeiro1130.03%
Alternate · PDT · No. 12244
Coalition: PP / PDT / PMDB

213Paulo do Sofa1120.03%
Alternate · PDT · No. 12113
Coalition: PP / PDT / PMDB
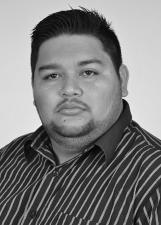
214Digão1100.03%
Alternate · PTN · No. 19900
Coalition: PT do B / PTN
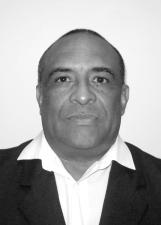
215Vilbe1100.03%
Alternate · PMN · No. 33333
Coalition: PTB / PPS / PRTB / PMN / PTC / PPL
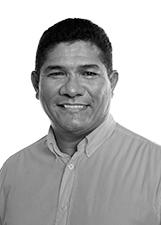
216Manoel Conceição1090.03%
Alternate · PSDB · No. 45132
Coalition: DEM / PSDB / SD / PSD
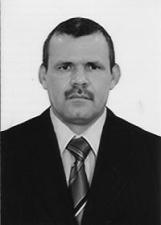
217Carlos Chagas Cachorrão1040.03%
Alternate · PSB · No. 40005
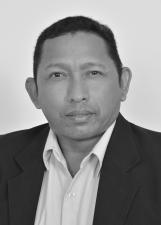
218Tony Lisboa1040.03%
Alternate · PRTB · No. 28888
Coalition: PTB / PPS / PRTB / PMN / PTC / PPL
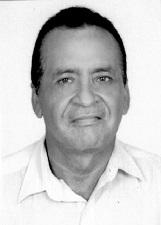
219Professor Raul990.03%
Alternate · SD · No. 77222
Coalition: DEM / PSDB / SD / PSD
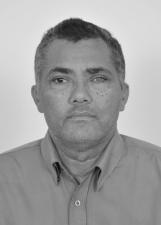
220Luis Lima970.02%
Alternate · PSC · No. 20444

221Marcelo Quintela950.02%
Alternate · PSDC · No. 27007
Coalition: PROS / PV / PSDC / PATRIOTA
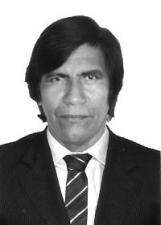
222Agenor Bruno930.02%
Alternate · PSB · No. 40120
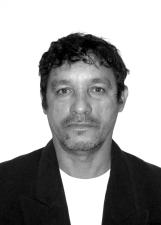
223Pinto Moto Taxi910.02%
Alternate · PTB · No. 14666
Coalition: PTB / PPS / PRTB / PMN / PTC / PPL
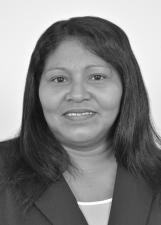
224Tia Isa890.02%
Alternate · PRTB · No. 28369
Coalition: PTB / PPS / PRTB / PMN / PTC / PPL
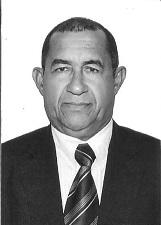
225Pastor José Barroso870.02%
Alternate · PSD · No. 55233
Coalition: DEM / PSDB / SD / PSD
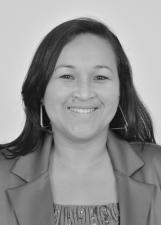
226Baby860.02%
Alternate · PDT · No. 12589
Coalition: PP / PDT / PMDB

227Waldir Castro830.02%
Alternate · PTC · No. 36190
Coalition: PTB / PPS / PRTB / PMN / PTC / PPL
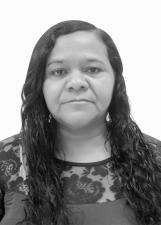
228Mery do Marabaixo810.02%
Alternate · PV · No. 43246
Coalition: PROS / PV / PSDC / PATRIOTA
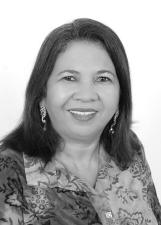
229Maria do PDT800.02%
Alternate · PDT · No. 12580
Coalition: PP / PDT / PMDB
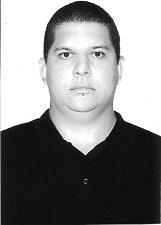
230Cristiano Vigilante790.02%
Alternate · PSD · No. 55369
Coalition: DEM / PSDB / SD / PSD
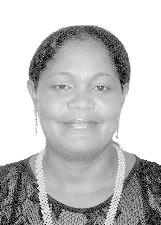
231Lete do Açai750.02%
Alternate · PSDB · No. 45789
Coalition: DEM / PSDB / SD / PSD
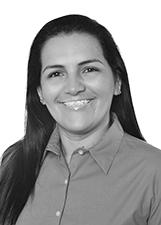
232Débora Braz720.02%
Alternate · PSDB · No. 45180
Coalition: DEM / PSDB / SD / PSD

233Felipão720.02%
Alternate · PSC · No. 20525
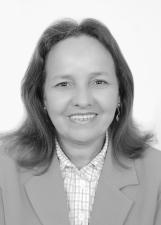
234Socorrinha670.02%
Alternate · PSOL · No. 50185
Coalition: PSOL / PT / PC do B
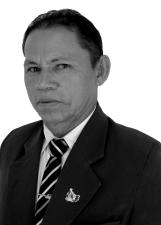
235Darney640.02%
Alternate · PTN · No. 19234
Coalition: PT do B / PTN
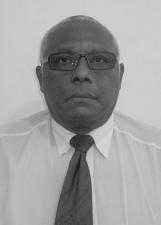
236Raimundo Sousa640.02%
Alternate · PSB · No. 40888
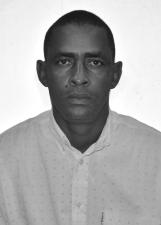
237Clei Almeida630.02%
Alternate · PSB · No. 40010
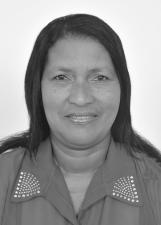
238Tamar Marinho620.02%
Alternate · PRTB · No. 28008
Coalition: PTB / PPS / PRTB / PMN / PTC / PPL

239Adauto Junior610.02%
Alternate · PTB · No. 14444
Coalition: PTB / PPS / PRTB / PMN / PTC / PPL
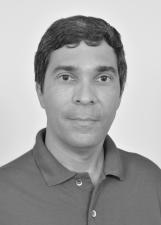
240Marcio Leite610.02%
Alternate · PRTB · No. 28300
Coalition: PTB / PPS / PRTB / PMN / PTC / PPL

241Bóbinho600.02%
Alternate · PTN · No. 19532
Coalition: PT do B / PTN
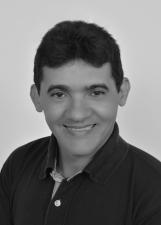
242Rabelo600.02%
Alternate · PT · No. 13802
Coalition: PSOL / PT / PC do B
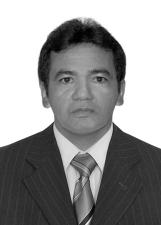
243Professor Matos590.02%
Alternate · PV · No. 43369
Coalition: PROS / PV / PSDC / PATRIOTA

244Elson Vilhena570.01%
Alternate · PRTB · No. 28678
Coalition: PTB / PPS / PRTB / PMN / PTC / PPL
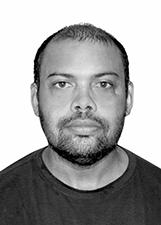
245Josué (o Carteiro)550.01%
Alternate · PC do B · No. 65113
Coalition: PSOL / PT / PC do B
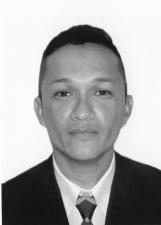
246Charlon do Pai520.01%
Alternate · PPS · No. 23555
Coalition: PTB / PPS / PRTB / PMN / PTC / PPL

247Ubiratan Junior520.01%
Alternate · PEN · No. 51555
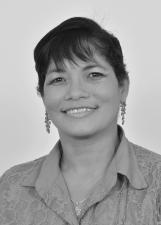
248Claudia Monteiro500.01%
Alternate · PTN · No. 19321
Coalition: PT do B / PTN
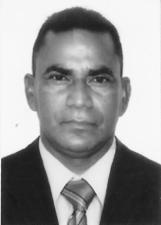
249Françua O Camaleão do Brega500.01%
Alternate · PSB · No. 40555
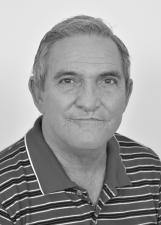
250Fonfon490.01%
Alternate · PRTB · No. 28444
Coalition: PTB / PPS / PRTB / PMN / PTC / PPL

251Paulo Edson490.01%
Alternate · PPL · No. 54122
Coalition: PTB / PPS / PRTB / PMN / PTC / PPL
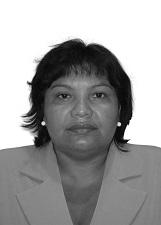
252Rose Costa490.01%
Alternate · PSD · No. 55669
Coalition: DEM / PSDB / SD / PSD
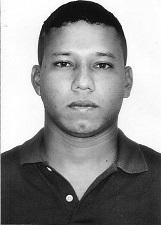
253Alex Sá470.01%
Alternate · PSD · No. 55321
Coalition: DEM / PSDB / SD / PSD

254Maria do Carmo470.01%
Alternate · PPL · No. 54444
Coalition: PTB / PPS / PRTB / PMN / PTC / PPL
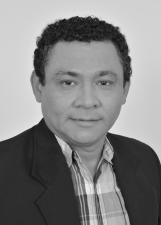
255Gabriel Dantas460.01%
Alternate · PTN · No. 19999
Coalition: PT do B / PTN
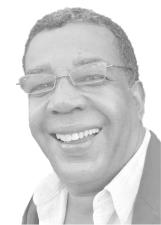
256Marcão450.01%
Alternate · PMDB · No. 15777
Coalition: PP / PDT / PMDB
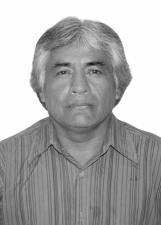
257Moisés Luz450.01%
Alternate · PRB · No. 10777
Coalition: PR / PRB / PHS
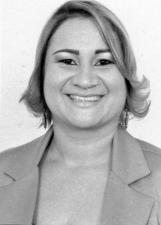
258Thaise450.01%
Alternate · PMN · No. 33114
Coalition: PTB / PPS / PRTB / PMN / PTC / PPL
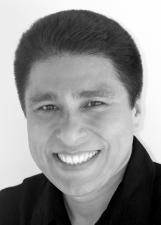
259Coronel Carvalho440.01%
PRP · No. 44190
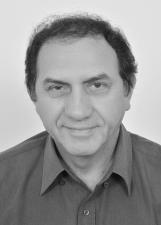
260Plácido Vieira420.01%
Alternate · PT · No. 13058
Coalition: PSOL / PT / PC do B

261Boiadeiro400.01%
Alternate · PSDB · No. 45321
Coalition: DEM / PSDB / SD / PSD
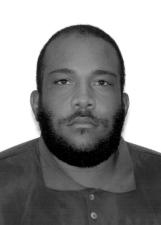
262Augusto Gugumom39<0.01%
Alternate · PSOL · No. 50237
Coalition: PSOL / PT / PC do B
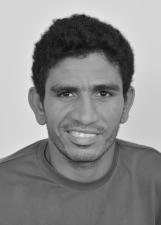
263Buchudo39<0.01%
Alternate · PEN · No. 51951
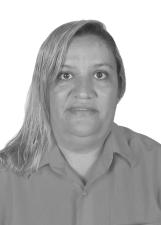
264Carla Vinhote39<0.01%
Alternate · PT · No. 13300
Coalition: PSOL / PT / PC do B
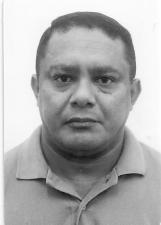
265Irmão Benny39<0.01%
Alternate · PTN · No. 19007
Coalition: PT do B / PTN

266Leocy Conceição39<0.01%
Alternate · PR · No. 22192
Coalition: PR / PRB / PHS

267Marcos Fernandes39<0.01%
Alternate · PTB · No. 14133
Coalition: PTB / PPS / PRTB / PMN / PTC / PPL
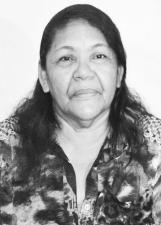
268Prof. Selma39<0.01%
Alternate · PSC · No. 20024
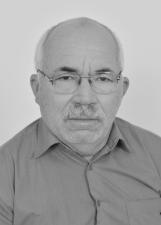
269José Lima38<0.01%
Alternate · PSC · No. 20002

270Manulo37<0.01%
Alternate · PSOL · No. 50888
Coalition: PSOL / PT / PC do B
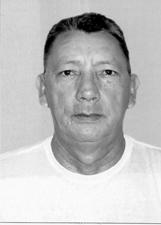
271Prof Beckman37<0.01%
Alternate · PP · No. 11245
Coalition: PP / PDT / PMDB
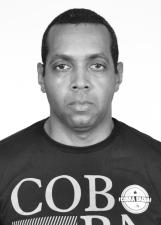
272Souza37<0.01%
Alternate · PSDC · No. 27258
Coalition: PROS / PV / PSDC / PATRIOTA

273Hildegard Gurgel29<0.01%
Alternate · PRB · No. 10100
Coalition: PR / PRB / PHS

274Brother Loyola28<0.01%
Alternate · PEN · No. 51000

275Giovana Santangelo28<0.01%
Alternate · PSC · No. 20555

276Jara Dias28<0.01%
Alternate · PROS · No. 90190
Coalition: PROS / PV / PSDC / PATRIOTA
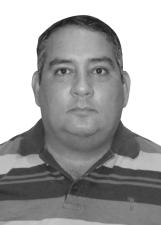
277Daniel Mota27<0.01%
Alternate · PV · No. 43067
Coalition: PROS / PV / PSDC / PATRIOTA
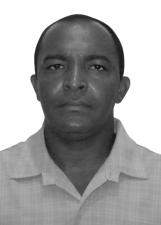
278Dorivaldo Costa26<0.01%
Alternate · PSD · No. 55021
Coalition: DEM / PSDB / SD / PSD
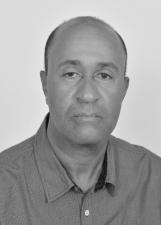
279Pr. Gonzaga26<0.01%
Alternate · PTC · No. 36111
Coalition: PTB / PPS / PRTB / PMN / PTC / PPL
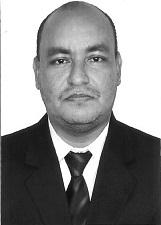
280Ronildo do Marabaixo26<0.01%
Alternate · PSD · No. 55223
Coalition: DEM / PSDB / SD / PSD
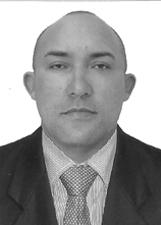
281Carlos Marques25<0.01%
Alternate · PP · No. 11122
Coalition: PP / PDT / PMDB
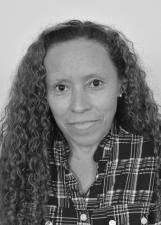
282Prof[ Vera Figueiredo23<0.01%
Alternate · PTN · No. 19000
Coalition: PT do B / PTN

283Euci Almeida21<0.01%
Alternate · PDT · No. 12777
Coalition: PP / PDT / PMDB

284Orlan Fonseca21<0.01%
Alternate · PSD · No. 55699
Coalition: DEM / PSDB / SD / PSD
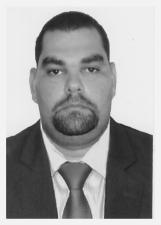
285Milton Santos18<0.01%
Alternate · PV · No. 43789
Coalition: PROS / PV / PSDC / PATRIOTA
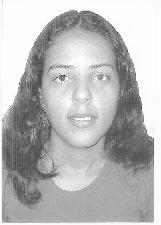
286Ane Melo14<0.01%
PSTU · No. 16016

287Angela Cantuaria14<0.01%
Alternate · PT · No. 13500
Coalition: PSOL / PT / PC do B
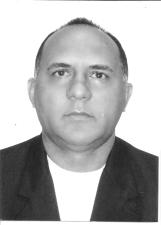
288Coronel Pessoa13<0.01%
PRP · No. 44444
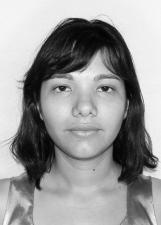
289Evelyn13<0.01%
Alternate · PSOL · No. 50001
Coalition: PSOL / PT / PC do B

290Rafael Pelaes10<0.01%
Alternate · PTN · No. 19129
Coalition: PT do B / PTN
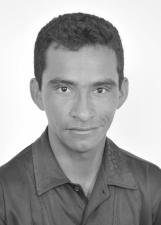
291Valdeci Lobato10<0.01%
Alternate · PSC · No. 20347
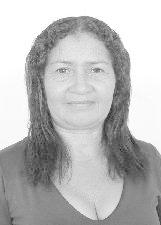
292Aldete9<0.01%
Alternate · PPL · No. 54222
Coalition: PTB / PPS / PRTB / PMN / PTC / PPL
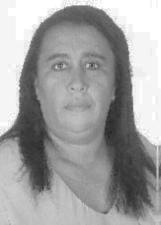
293Lene9<0.01%
Alternate · PSC · No. 20896

294Dimas Marinho8<0.01%
PRP · No. 44221
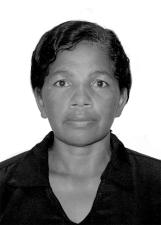
295Maura Rodrigues8<0.01%
Alternate · PV · No. 43231
Coalition: PROS / PV / PSDC / PATRIOTA

296Professor Rener Passos6<0.01%
Alternate · PRB · No. 10200
Coalition: PR / PRB / PHS

297Ana Camila5<0.01%
Alternate · PR · No. 22022
Coalition: PR / PRB / PHS
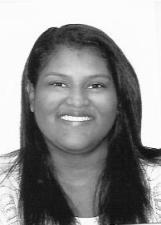
298Emilli Videira5<0.01%
Alternate · PSB · No. 40777

299Regilene Menezes4<0.01%
Alternate · PSC · No. 20500
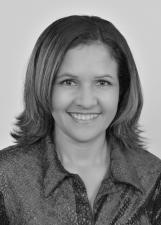
300Vanete Castro4<0.01%
Alternate · PR · No. 22080
Coalition: PR / PRB / PHS

301Cleuma Duarte3<0.01%
Alternate · PSC · No. 20789

302Mauro Gemaque3<0.01%
Alternate · PT do B · No. 70753
Coalition: PT do B / PTN

303Naiara3<0.01%
Alternate · PROS · No. 90111
Coalition: PROS / PV / PSDC / PATRIOTA

304Oziel Palmerim3<0.01%
Alternate · PT do B · No. 70333
Coalition: PT do B / PTN

305Elisangela2<0.01%
Alternate · PT · No. 13400
Coalition: PSOL / PT / PC do B
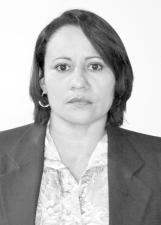
306Jucy2<0.01%
Alternate · PSDC · No. 27456
Coalition: PROS / PV / PSDC / PATRIOTA
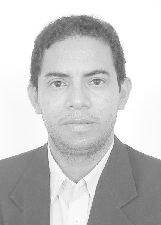
307Pastor Edson2<0.01%
Alternate · PPL · No. 54000
Coalition: PTB / PPS / PRTB / PMN / PTC / PPL
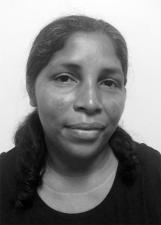
308Roseli Cleide2<0.01%
Alternate · PSD · No. 55400
Coalition: DEM / PSDB / SD / PSD
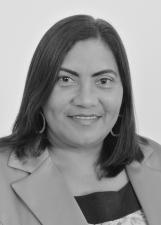
309Socorro Nogueira2<0.01%
Alternate · PEN · No. 51051

310Tina Ideia2<0.01%
Alternate · PEN · No. 51789

311Alex Pereira1<0.01%
Alternate · PHS · No. 31800
Coalition: PR / PRB / PHS

312Ana Lice1<0.01%
Alternate · PSDB · No. 45145
Coalition: DEM / PSDB / SD / PSD

313Andressa Kelly1<0.01%
Alternate · PSC · No. 20007

314Cris da Anastasia1<0.01%
Alternate · PT do B · No. 70654
Coalition: PT do B / PTN

315Delma1<0.01%
Alternate · PPL · No. 54456
Coalition: PTB / PPS / PRTB / PMN / PTC / PPL
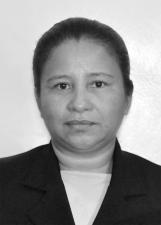
316Edineuza Brito1<0.01%
Alternate · PPL · No. 54380
Coalition: PTB / PPS / PRTB / PMN / PTC / PPL
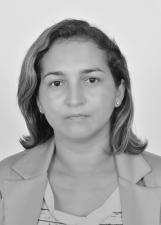
317Eliana Lima1<0.01%
Alternate · PR · No. 22003
Coalition: PR / PRB / PHS
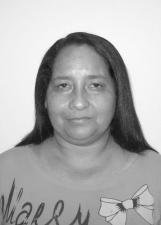
318Izamar1<0.01%
PRP · No. 44888

319Luany Favacho1<0.01%
Alternate · PROS · No. 90699
Coalition: PROS / PV / PSDC / PATRIOTA
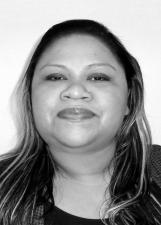
320Mana Rízia1<0.01%
PRP · No. 44200
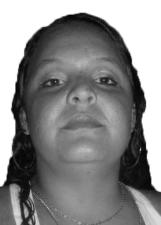
321Marilia Moura1<0.01%
Alternate · PC do B · No. 65321
Coalition: PSOL / PT / PC do B
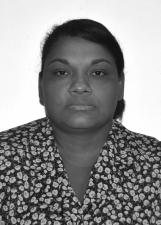
322Rute Helena1<0.01%
Alternate · PSOL · No. 50542
Coalition: PSOL / PT / PC do B
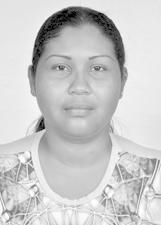
323Claudinete0
Alternate · PSOL · No. 50760
Coalition: PSOL / PT / PC do B
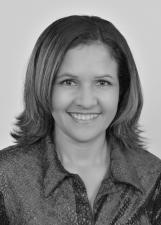
324Célia Amorim0
Alternate · PR · No. 22189
Coalition: PR / PRB / PHS
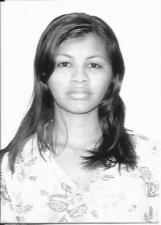
325Gleice Gomes0
Alternate · PSB · No. 40689
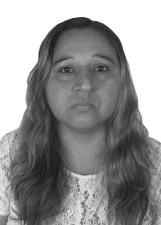
326Jeovaneti0
Alternate · PSOL · No. 50658
Coalition: PSOL / PT / PC do B

327Lucia Bastos0
Alternate · PRTB · No. 28900
Coalition: PTB / PPS / PRTB / PMN / PTC / PPL
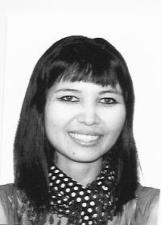
328Maria Brito0
Alternate · PSB · No. 40666
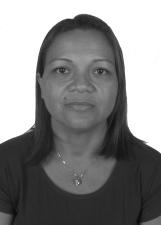
329Neuza Alves0
Alternate · PSOL · No. 50751
Coalition: PSOL / PT / PC do B
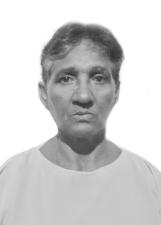
330Rocher0
Alternate · PT do B · No. 70246
Coalition: PT do B / PTN
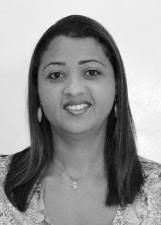
331Rosa Abdon0
Alternate · PR · No. 22822
Coalition: PR / PRB / PHS

332Sandra Abreu0
PRP · No. 44258

333Zé do Shopping0
Alternate · PRB · No. 10999
Coalition: PR / PRB / PHS
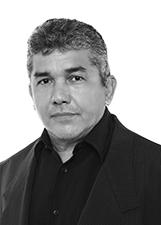
—Prof. Valente18
Annulled votesIneligible to run · PSDB · No. 45266
Coalition: DEM / PSDB / SD / PSD
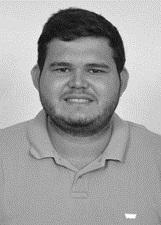
—Ramon Valente16
Annulled votesIneligible to run · SD · No. 77000
Coalition: DEM / PSDB / SD / PSD
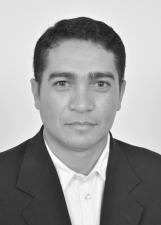
—Jo Pereira5
Annulled votesIneligible to run · PEN · No. 51111
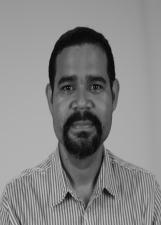
—Renivaldo Costa4
Annulled votesIneligible to run · PRP · No. 44000

—Clara Nunes1
Annulled votesIneligible to run · PR · No. 22522
Coalition: PR / PRB / PHS


