In 2018, in Santa Catarina, 40 state deputies were elected, according to data from Brazil's Superior Electoral Court (TSE). The largest caucus was that of MDB (9). The most votes went to Alba (PSL), with 62,762 votes (1.71% of the valid votes). The electoral quotient was about 91,582 votes, and the lowest vote total among those elected was 14,685: seats are allocated to the party first.
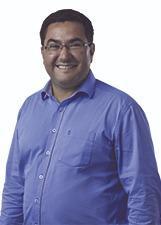
1Alba62,7621.71%
Elected · PSL · No. 17017
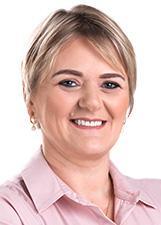
2Luciane Carminatti61,2711.67%
Elected · PT · No. 13601
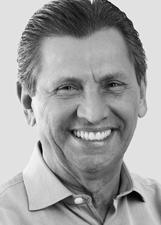
3Julio Garcia57,7721.58%
Elected · PSD · No. 55111
Coalition: PSD / PP / PSC

4Ismael54,1651.48%
Elected · PSD · No. 55777
Coalition: PSD / PP / PSC

5Paulinha51,7391.41%
Elected · PDT · No. 12012
Coalition: PC do B / PDT / PHS / PODE
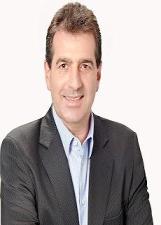
6Cobalchini49,3551.35%
Elected · MDB · No. 15200
Coalition: MDB / PSDB
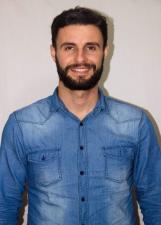
7Felipe Estevão47,3901.29%
Elected · PSL · No. 17777
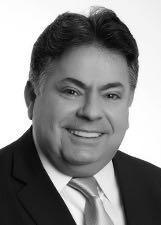
8Sergio Motta45,1811.23%
Elected · PRB · No. 10123
Coalition: PSB / PRB / SOLIDARIEDADE
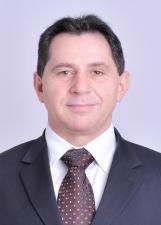
9Coronel Mocellin45,0861.23%
Elected · PSL · No. 17193

10Fernando Krelling44,3561.21%
Elected · MDB · No. 15655
Coalition: MDB / PSDB
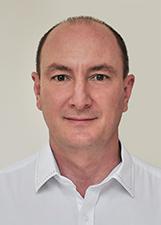
11De Nadal42,5071.16%
Elected · MDB · No. 15220
Coalition: MDB / PSDB
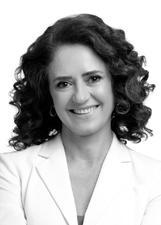
12Marlene Fengler41,6841.14%
Elected · PSD · No. 55123
Coalition: PSD / PP / PSC
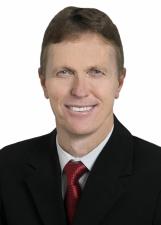
13Volnei Weber41,3531.13%
Elected · MDB · No. 15000
Coalition: MDB / PSDB
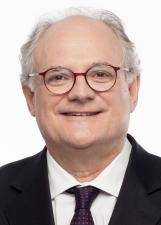
14Dr. Vicente Caropreso40,1321.10%
Elected · PSDB · No. 45999
Coalition: MDB / PSDB
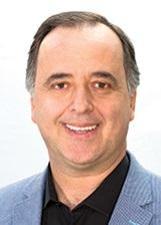
15Kennedy Nunes39,3521.07%
Elected · PSD · No. 55100
Coalition: PSD / PP / PSC
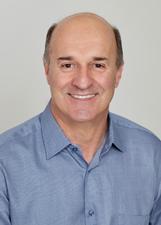
16Zé Milton39,1961.07%
Elected · PP · No. 11234
Coalition: PSD / PP / PSC
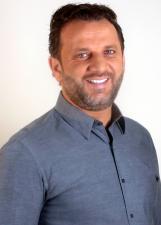
17Jerry do Aldo39,1311.07%
Elected · MDB · No. 15010
Coalition: MDB / PSDB
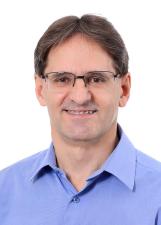
18Neodi Saretta39,0361.07%
Elected · PT · No. 13120
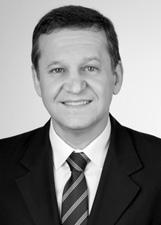
19Jair Miotto38,5541.05%
Elected · PSC · No. 20104
Coalition: PSD / PP / PSC

20Laércio Schuster36,9231.01%
Elected · PSB · No. 40111
Coalition: PSB / PRB / SOLIDARIEDADE
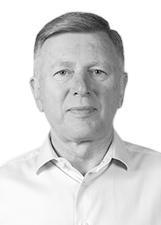
21Milton Hobus36,8211.01%
Elected · PSD · No. 55858
Coalition: PSD / PP / PSC

22Vampiro - Luiz Fernando36,7471.00%
Elected · MDB · No. 15150
Coalition: MDB / PSDB
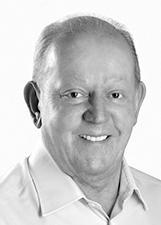
23Marcos Vieira35,4230.97%
Elected · PSDB · No. 45699
Coalition: MDB / PSDB
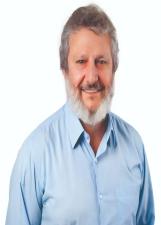
24Padre Pedro35,1840.96%
Elected · PT · No. 13987
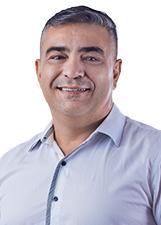
25Sargento Lima35,0530.96%
Elected · PSL · No. 17107

26Ana Caroline Campagnolo34,8250.95%
Elected · PSL · No. 17771
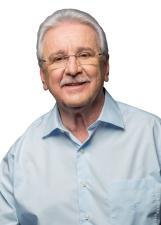
27Moacir Sopelsa34,7220.95%
Elected · MDB · No. 15180
Coalition: MDB / PSDB
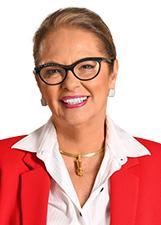
28Ada Faraco de Luca34,5010.94%
Elected (remainder seat) · MDB · No. 15015
Coalition: MDB / PSDB
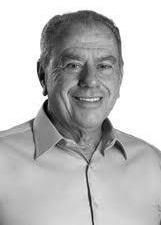
29Nazareno Martins34,3950.94%
Elected · PSB · No. 40369
Coalition: PSB / PRB / SOLIDARIEDADE
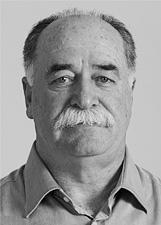
30Titon34,3500.94%
Elected (remainder seat) · MDB · No. 15270
Coalition: MDB / PSDB

31Bruno Souza32,5120.89%
Elected · PSB · No. 40030
Coalition: PSB / PRB / SOLIDARIEDADE
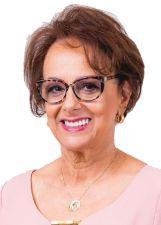
32Dirce Heiderscheidt32,3320.88%
Alternate · MDB · No. 15234
Coalition: MDB / PSDB
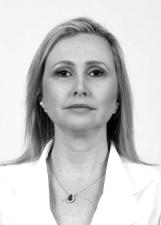
33Anna Carolina32,1990.88%
Alternate · PSDB · No. 45456
Coalition: MDB / PSDB

34Jessé Lopes31,5950.86%
Elected · PSL · No. 17010
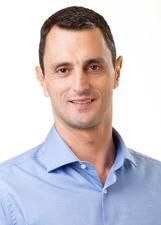
35João Amin31,3960.86%
Elected · PP · No. 11333
Coalition: PSD / PP / PSC
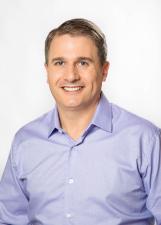
36Altair Silva30,4970.83%
Elected (remainder seat) · PP · No. 11130
Coalition: PSD / PP / PSC

37Marcius Machado30,2770.83%
Elected · PR · No. 22123
Coalition: PTB / PTC / PRTB / DC / AVANTE / PR / PPS
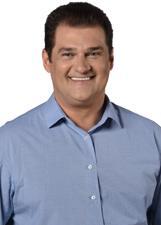
38Cleiton Salvaro30,1920.82%
Alternate · PSB · No. 40110
Coalition: PSB / PRB / SOLIDARIEDADE
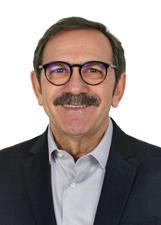
39Serafim Venzon30,0850.82%
Alternate · PSDB · No. 45145
Coalition: MDB / PSDB
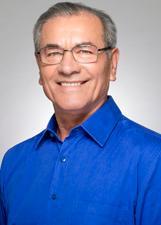
40Silvio Dreveck29,6310.81%
Alternate · PP · No. 11311
Coalition: PSD / PP / PSC
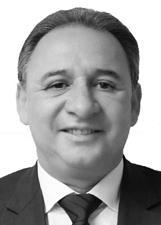
41Dóia Guglielmi29,5600.81%
Alternate · PSDB · No. 45110
Coalition: MDB / PSDB
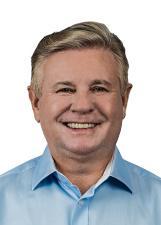
42Berlanda28,9750.79%
Elected · PR · No. 22022
Coalition: PTB / PTC / PRTB / DC / AVANTE / PR / PPS

43Jean Kuhlmann28,8300.79%
Alternate · PSD · No. 55800
Coalition: PSD / PP / PSC

44Delegado Ulisses Gabriel28,1830.77%
Alternate · PSD · No. 55789
Coalition: PSD / PP / PSC
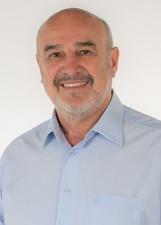
45Gallina27,3800.75%
Alternate · MDB · No. 15123
Coalition: MDB / PSDB

46Lucas Neves26,7940.73%
Alternate · PP · No. 11011
Coalition: PSD / PP / PSC
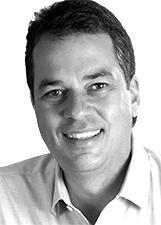
47Rodrigo Minotto26,6230.73%
Elected · PDT · No. 12345
Coalition: PC do B / PDT / PHS / PODE
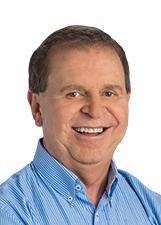
48Mauricio Eskudlark26,3330.72%
Elected (remainder seat) · PR · No. 22222
Coalition: PTB / PTC / PRTB / DC / AVANTE / PR / PPS
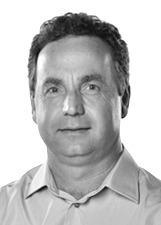
49Dieter26,2440.72%
Alternate · PP · No. 11111
Coalition: PSD / PP / PSC

50Pepê Collaço24,9110.68%
Alternate · PP · No. 11223
Coalition: PSD / PP / PSC
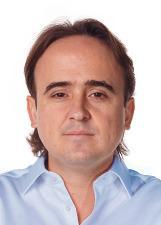
51Carlos Humberto24,6100.67%
Alternate · PR · No. 22444
Coalition: PTB / PTC / PRTB / DC / AVANTE / PR / PPS

52Gabriel Ribeiro24,1160.66%
Alternate · PSD · No. 55282
Coalition: PSD / PP / PSC

53Renato Pike23,4070.64%
Alternate · PR · No. 22555
Coalition: PTB / PTC / PRTB / DC / AVANTE / PR / PPS
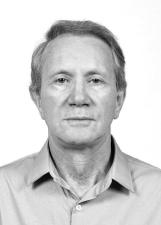
54Carelli22,8000.62%
Alternate · PSDB · No. 45123
Coalition: MDB / PSDB
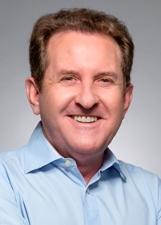
55Valmir Comin22,5970.62%
Alternate · PP · No. 11166
Coalition: PSD / PP / PSC
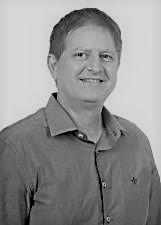
56Grando22,5620.62%
Alternate · MDB · No. 15600
Coalition: MDB / PSDB

57Patricio Destro22,1460.60%
Alternate · PSB · No. 40123
Coalition: PSB / PRB / SOLIDARIEDADE
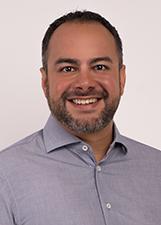
58Thiago Morastoni21,4580.59%
Alternate · MDB · No. 15111
Coalition: MDB / PSDB
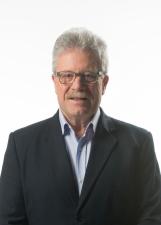
59Leoberto Weinert20,6790.56%
Alternate · MDB · No. 15215
Coalition: MDB / PSDB
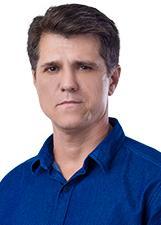
60Sargento Floriano20,1550.55%
Alternate · PSL · No. 17027
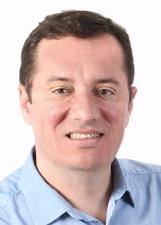
61Edson Piriquito20,0630.55%
Alternate · MDB · No. 15115
Coalition: MDB / PSDB

62Frigo19,8680.54%
Alternate · PSL · No. 17000
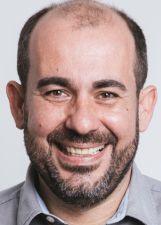
63Rodrigo Fachini19,4520.53%
Alternate · MDB · No. 15615
Coalition: MDB / PSDB
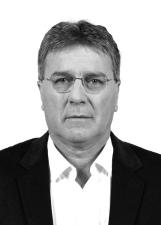
64Dr. Tomazini19,0790.52%
Alternate · PSDB · No. 45045
Coalition: MDB / PSDB
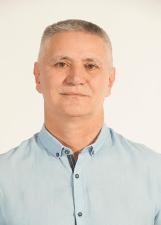
65Elson Pereira18,6520.51%
PSOL · No. 50150
Coalition: PSOL / PCB
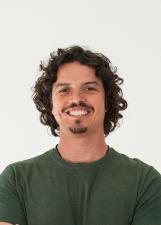
66Marquito -Marcos José de Abreu18,5480.51%
PSOL · No. 50350
Coalition: PSOL / PCB

67Fabiano da Luz18,4740.50%
Elected (remainder seat) · PT · No. 13450
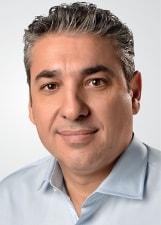
68Mario Marcondes18,2570.50%
Alternate · MDB · No. 15580
Coalition: MDB / PSDB
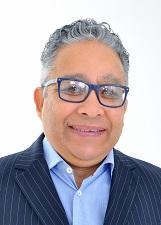
69Dr. João17,9450.49%
Alternate · PSB · No. 40400
Coalition: PSB / PRB / SOLIDARIEDADE
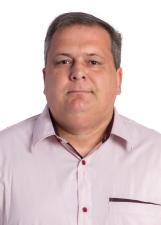
70Turatti17,5210.48%
Alternate · PSL · No. 17117

71Rafael Laske - Mamão17,4970.48%
Alternate · PSD · No. 55155
Coalition: PSD / PP / PSC
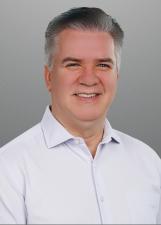
72Valduga16,7030.46%
Alternate · PC do B · No. 65123
Coalition: PC do B / PDT / PHS / PODE

73Evandro Scaini16,5550.45%
Alternate · PSD · No. 55333
Coalition: PSD / PP / PSC
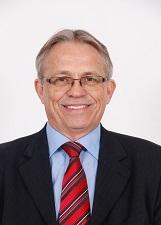
74Carlito Merss14,9600.41%
Alternate · PT · No. 13212
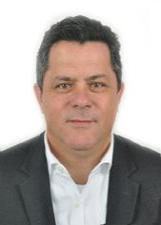
75Ivan Naatz14,6850.40%
Elected · PV · No. 43555
Coalition: DEM / PROS / PPL / PRP / PV

76Leonardo Secchi14,5580.40%
Alternate · PSB · No. 40000
Coalition: PSB / PRB / SOLIDARIEDADE
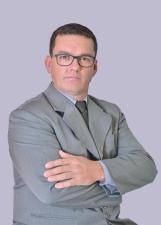
77Policial Fernando Beilfuss14,2560.39%
Alternate · PSL · No. 17500
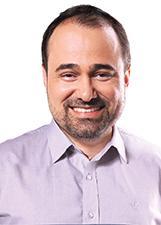
78Cleiton Fossa14,2210.39%
Alternate · MDB · No. 15800
Coalition: MDB / PSDB
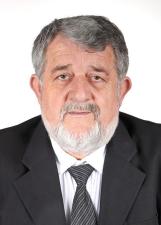
79Osmar Vicentini13,9180.38%
Alternate · PSL · No. 17444
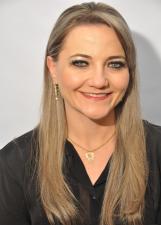
80Ruti Rossi13,9030.38%
Alternate · PSL · No. 17890
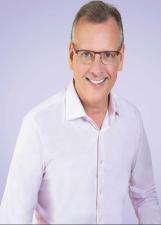
81Paulo Eccel13,7500.38%
Alternate · PT · No. 13030
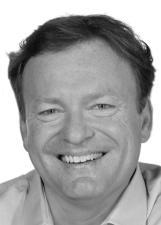
82Fabiano Dadam Nau13,4560.37%
Alternate · PSB · No. 40888
Coalition: PSB / PRB / SOLIDARIEDADE
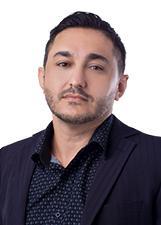
83Adrianinho Junkes13,1310.36%
Alternate · PSL · No. 17888

84Anelísio da Assessoritec13,0130.36%
Alternate · PSD · No. 55000
Coalition: PSD / PP / PSC
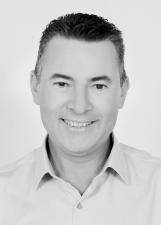
85Abel Hack12,9460.35%
Alternate · PSB · No. 40700
Coalition: PSB / PRB / SOLIDARIEDADE
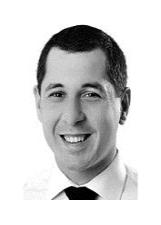
86Níkolas Reis12,6740.35%
Alternate · PSB · No. 40333
Coalition: PSB / PRB / SOLIDARIEDADE
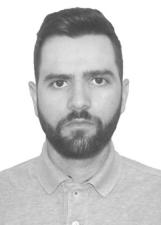
87André de Oliveira12,3260.34%
Alternate · PODE · No. 19007
Coalition: PC do B / PDT / PHS / PODE
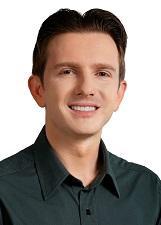
88Adrianinho12,3250.34%
Alternate · PT · No. 13013

89Bruno Cunha12,2800.34%
Alternate · PSB · No. 40140
Coalition: PSB / PRB / SOLIDARIEDADE
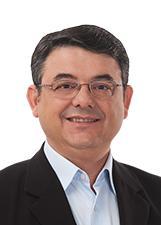
90Mauricio Peixer12,2790.34%
Alternate · PR · No. 22620
Coalition: PTB / PTC / PRTB / DC / AVANTE / PR / PPS
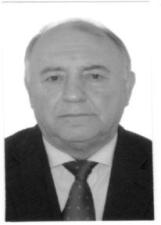
91Natalino Lázare12,2450.33%
Alternate · PODE · No. 19000
Coalition: PC do B / PDT / PHS / PODE

92Rodrigo Bornholdt12,2430.33%
Alternate · PDT · No. 12300
Coalition: PC do B / PDT / PHS / PODE
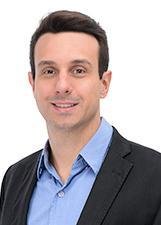
93Badotti12,1470.33%
Alternate · PSL · No. 17555
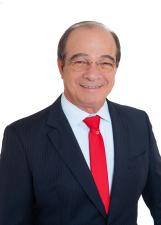
94Celso Zuchi12,1400.33%
Alternate · PT · No. 13456
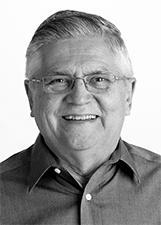
95Prof. Rodolfo Pinto da Luz12,0840.33%
Alternate · PSD · No. 55555
Coalition: PSD / PP / PSC

96Lei Alexandre11,7900.32%
Alternate · PP · No. 11611
Coalition: PSD / PP / PSC

97Fedra Konell11,5280.31%
Alternate · PSB · No. 40040
Coalition: PSB / PRB / SOLIDARIEDADE
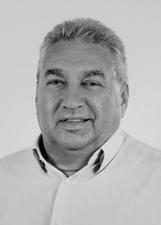
98Barbieri11,2920.31%
Alternate · PSD · No. 55055
Coalition: PSD / PP / PSC

99Almir Vieira11,2890.31%
Alternate · PP · No. 11677
Coalition: PSD / PP / PSC
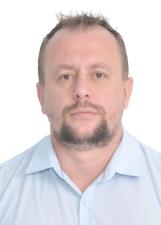
100Ademar Popeye11,2770.31%
Alternate · PSL · No. 17007
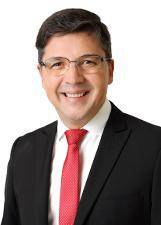
101Otto Quintino11,2610.31%
Alternate · PRB · No. 10777
Coalition: PSB / PRB / SOLIDARIEDADE

102Tati Teixeira11,2560.31%
Alternate · PPS · No. 23100
Coalition: PTB / PTC / PRTB / DC / AVANTE / PR / PPS

103Coronel Paulo Henrique10,8670.30%
Alternate · PSB · No. 40190
Coalition: PSB / PRB / SOLIDARIEDADE
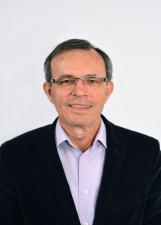
104Serginho10,8640.30%
Alternate · MDB · No. 15500
Coalition: MDB / PSDB

105Alisson10,6210.29%
Alternate · PODE · No. 19019
Coalition: PC do B / PDT / PHS / PODE

106Jaksom Castelli10,4680.29%
Alternate · DEM · No. 25500
Coalition: DEM / PROS / PPL / PRP / PV

107Jean de Liz10,3410.28%
Alternate · PT · No. 13123
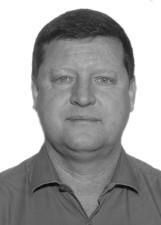
108Sidney Sabel9,8080.27%
Alternate · DEM · No. 25777
Coalition: DEM / PROS / PPL / PRP / PV

109Rafael Ramthum9,7500.27%
Alternate · PP · No. 11222
Coalition: PSD / PP / PSC
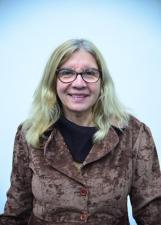
110Tania Larson9,5580.26%
Alternate · SOLIDARIEDADE · No. 77444
Coalition: PSB / PRB / SOLIDARIEDADE
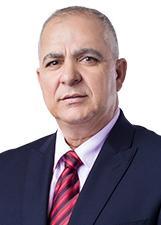
111Hélio Gonçalves9,2000.25%
Alternate · PSL · No. 17177

112Professor Guilherme Marchewsky9,0190.25%
Alternate · PPS · No. 23888
Coalition: PTB / PTC / PRTB / DC / AVANTE / PR / PPS
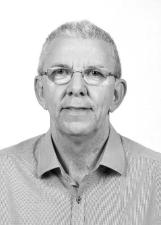
113Jens Mantau9,0130.25%
Alternate · PSDB · No. 45678
Coalition: MDB / PSDB
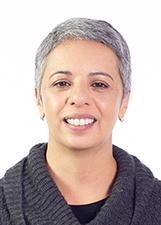
114Edileuza Fortuna8,9150.24%
PSOL · No. 50789
Coalition: PSOL / PCB
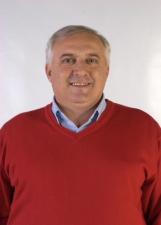
115Zeca Bombeiro8,8630.24%
Alternate · SOLIDARIEDADE · No. 77193
Coalition: PSB / PRB / SOLIDARIEDADE
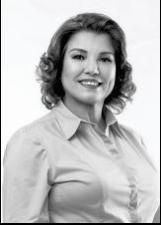
116Delegada Marilisa Boehm8,5590.23%
Alternate · PODE · No. 19190
Coalition: PC do B / PDT / PHS / PODE

117Andrey Tomazi8,4980.23%
Alternate · DEM · No. 25000
Coalition: DEM / PROS / PPL / PRP / PV
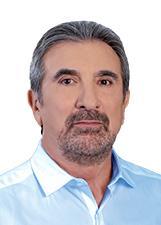
118Elio Cella8,4870.23%
Alternate · PR · No. 22233
Coalition: PTB / PTC / PRTB / DC / AVANTE / PR / PPS
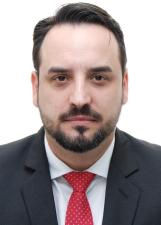
119Diogo Bertelli8,4690.23%
Alternate · PSL · No. 17123
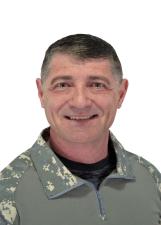
120Bruno Pellegrini8,3150.23%
Alternate · PSL · No. 17270

121Dany Alves8,1890.22%
Alternate · PSL · No. 17100
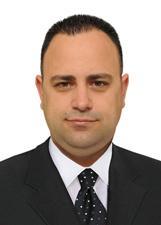
122Adriano Pereira8,1840.22%
Alternate · PT · No. 13555
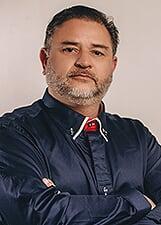
123Policial Juliano Pedrini8,0610.22%
Alternate · PSB · No. 40181
Coalition: PSB / PRB / SOLIDARIEDADE

124Chico Goetten7,9640.22%
Alternate · PP · No. 11000
Coalition: PSD / PP / PSC

125Jatir Balbinot7,9570.22%
Alternate · PDT · No. 12678
Coalition: PC do B / PDT / PHS / PODE

126Thiago Oliveira7,9260.22%
Alternate · MDB · No. 15147
Coalition: MDB / PSDB
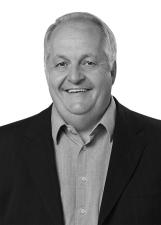
127Nilson Bylaardt7,7640.21%
Alternate · MDB · No. 15444
Coalition: MDB / PSDB
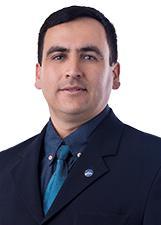
128Jeferson Lopes7,4930.20%
Alternate · PSL · No. 17789
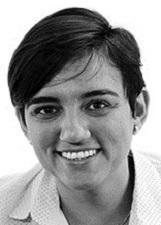
129Carla Ayres7,4710.20%
Alternate · PT · No. 13044
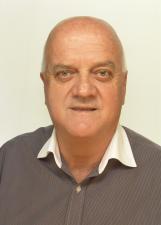
130Olavio Falchetti7,3690.20%
Alternate · PT · No. 13413
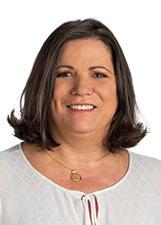
131Salete Cardoso7,1890.20%
Alternate · PR · No. 22223
Coalition: PTB / PTC / PRTB / DC / AVANTE / PR / PPS

132Marcelo Deputado Esperança7,1620.20%
Alternate · PODE · No. 19619
Coalition: PC do B / PDT / PHS / PODE
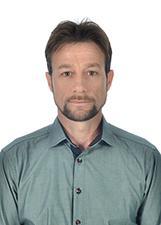
133Ivo Silveira6,8030.19%
Alternate · PSL · No. 17040

134Sylvio Zimmermann Neto6,7470.18%
Alternate · PSDB · No. 45645
Coalition: MDB / PSDB
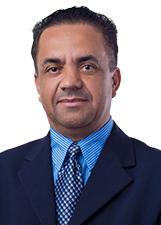
135Professor Marcos6,7380.18%
Alternate · PSL · No. 17333
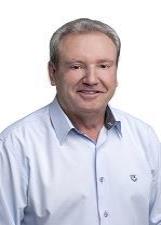
136Odir Nunes6,7120.18%
Alternate · PSDB · No. 45000
Coalition: MDB / PSDB

137Adriana Pivato6,5370.18%
Alternate · PSL · No. 17770
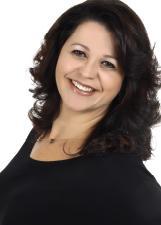
138Sandra Martins6,5080.18%
Alternate · PSDB · No. 45789
Coalition: MDB / PSDB
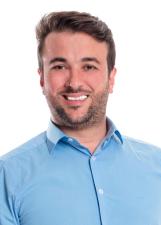
139Jones Bosio6,3760.17%
Alternate · DEM · No. 25222
Coalition: DEM / PROS / PPL / PRP / PV
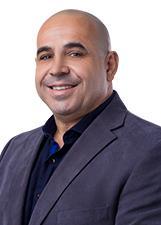
140Pawlick6,2880.17%
Alternate · PSL · No. 17190
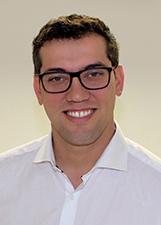
141Thiago Teixeira6,2640.17%
Alternate · PSDB · No. 45245
Coalition: MDB / PSDB
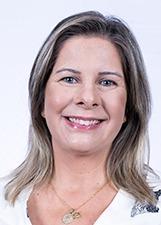
142Pri Fernandes Adote6,1810.17%
Alternate · PSB · No. 40444
Coalition: PSB / PRB / SOLIDARIEDADE
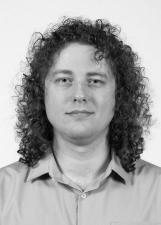
143Fitzen6,0720.17%
Alternate · PSDB · No. 45222
Coalition: MDB / PSDB
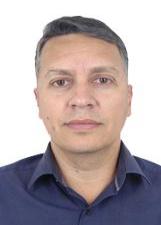
144Jean Pirola5,9300.16%
Alternate · PP · No. 11444
Coalition: PSD / PP / PSC

145Bruno Hartmann5,8410.16%
Alternate · PSDB · No. 45345
Coalition: MDB / PSDB

146Dra Katia Chubaci5,6700.15%
Alternate · MDB · No. 15777
Coalition: MDB / PSDB
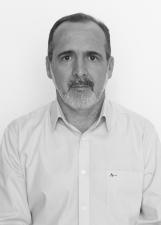
147Betinho Souza5,5730.15%
Alternate · PPS · No. 23000
Coalition: PTB / PTC / PRTB / DC / AVANTE / PR / PPS
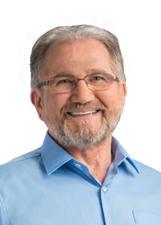
148Mattiolo5,5620.15%
Alternate · PR · No. 22345
Coalition: PTB / PTC / PRTB / DC / AVANTE / PR / PPS
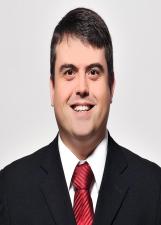
149Cirino Cabral5,0980.14%
Alternate · MDB · No. 15555
Coalition: MDB / PSDB
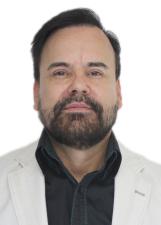
150Dr. Lauro Nogueira5,0710.14%
Alternate · PT · No. 13130
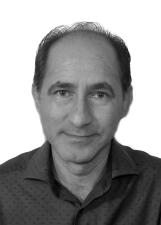
151Claudemir Matias5,0630.14%
Alternate · PSB · No. 40100
Coalition: PSB / PRB / SOLIDARIEDADE

152Lisi Tuon5,0410.14%
Alternate · DEM · No. 25888
Coalition: DEM / PROS / PPL / PRP / PV
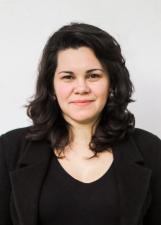
153Ligia Moreiras5,0300.14%
PSOL · No. 50180
Coalition: PSOL / PCB
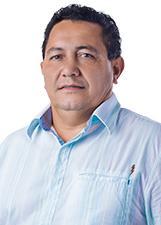
154Sadi Ribeiro4,9930.14%
Alternate · PSL · No. 17001
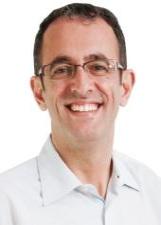
155Murilo Cordeiro4,8020.13%
Alternate · PT · No. 13444

156Jane Stefenn4,7600.13%
REDE · No. 18800
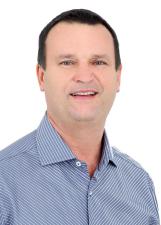
157Marconi4,6500.13%
Alternate · DEM · No. 25100
Coalition: DEM / PROS / PPL / PRP / PV
158Dr. Jonas Dentista4,5390.12%
Alternate · PSDB · No. 45710
Coalition: MDB / PSDB
159Valdeci Motta4,5040.12%
Alternate · PODE · No. 19777
Coalition: PC do B / PDT / PHS / PODE
160Claudia Bus4,3790.12%
Alternate · PTB · No. 14777
Coalition: PTB / PTC / PRTB / DC / AVANTE / PR / PPS
161Wanderley Amora4,3410.12%
Alternate · PSL · No. 17567
162Cléo Figur4,3410.12%
Alternate · PSD · No. 55999
Coalition: PSD / PP / PSC

163Alan Felippi4,2960.12%
Alternate · PR · No. 22000
Coalition: PTB / PTC / PRTB / DC / AVANTE / PR / PPS
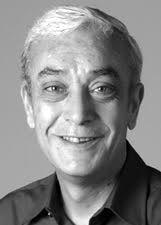
164Sargento Damiani4,2630.12%
Alternate · PDT · No. 12580
Coalition: PC do B / PDT / PHS / PODE

165Marcio Araújo4,2470.12%
Alternate · PRB · No. 10000
Coalition: PSB / PRB / SOLIDARIEDADE
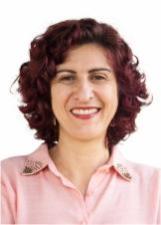
166Sayonara4,2440.12%
Alternate · PT · No. 13031

167Léo Pavanello4,2420.12%
Alternate · PT · No. 13000
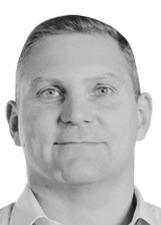
168Thomazi4,2420.12%
Alternate · PP · No. 11100
Coalition: PSD / PP / PSC

169Américo do Nascimento Junior4,2350.12%
Alternate · PSD · No. 55888
Coalition: PSD / PP / PSC
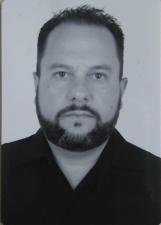
170Marcos Deichmann4,2320.12%
PATRI · No. 51000
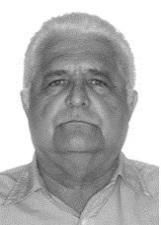
171Montibeller4,2020.11%
Alternate · PODE · No. 19999
Coalition: PC do B / PDT / PHS / PODE

172Jean Ramos4,2020.11%
Alternate · PP · No. 11033
Coalition: PSD / PP / PSC
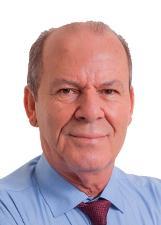
173Erádio Gonçalves4,1970.11%
Alternate · PR · No. 22333
Coalition: PTB / PTC / PRTB / DC / AVANTE / PR / PPS

174Casimiro Konkel4,1250.11%
Alternate · PT · No. 13700
175Oldemar Becker4,0680.11%
Alternate · DEM · No. 25025
Coalition: DEM / PROS / PPL / PRP / PV
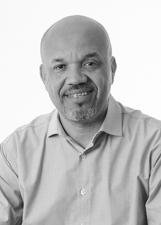
176Ary Souza4,0480.11%
Alternate · PPS · No. 23123
Coalition: PTB / PTC / PRTB / DC / AVANTE / PR / PPS
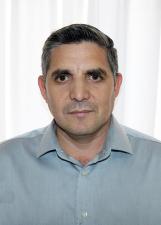
177Clair Lima3,9950.11%
Alternate · PSL · No. 17456
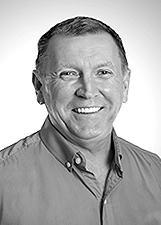
178Jonas Schmidt3,9620.11%
Alternate · DEM · No. 25630
Coalition: DEM / PROS / PPL / PRP / PV
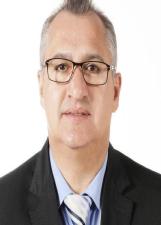
179Neidão3,8840.11%
Alternate · SOLIDARIEDADE · No. 77123
Coalition: PSB / PRB / SOLIDARIEDADE

180Sandra Parma3,7880.10%
PMN · No. 33333
Coalition: PMN / PATRIOTA

181Suelen Lara3,7730.10%
Alternate · PSL · No. 17180
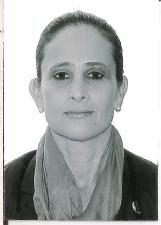
182Jumeri Zanetti3,7220.10%
Alternate · PT · No. 13223
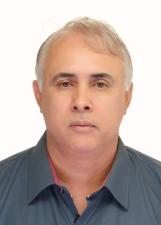
183Dr. Jefferson3,6950.10%
Alternate · PPS · No. 23777
Coalition: PTB / PTC / PRTB / DC / AVANTE / PR / PPS

184Jeferson Vieira3,6860.10%
Alternate · DEM · No. 25123
Coalition: DEM / PROS / PPL / PRP / PV

185Valdeir da Padre Pio3,6760.10%
Alternate · PTB · No. 14000
Coalition: PTB / PTC / PRTB / DC / AVANTE / PR / PPS
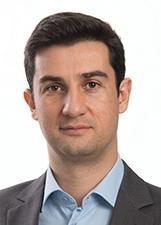
186André Meirinho3,5330.10%
Alternate · PP · No. 11300
Coalition: PSD / PP / PSC

187Cesar Paraná3,4890.10%
Alternate · PRP · No. 44777
Coalition: DEM / PROS / PPL / PRP / PV

188Ramiro Zinder3,4750.09%
Alternate · DEM · No. 25625
Coalition: DEM / PROS / PPL / PRP / PV
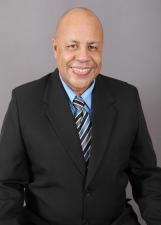
189Ângelo3,4570.09%
Alternate · PSD · No. 55005
Coalition: PSD / PP / PSC
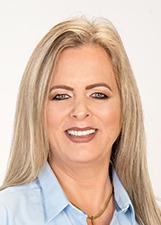
190Kika - Maria Helena3,4420.09%
Alternate · PR · No. 22522
Coalition: PTB / PTC / PRTB / DC / AVANTE / PR / PPS
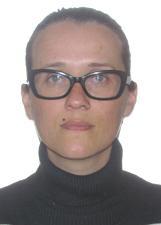
191Geórgia Faust3,4240.09%
PSOL · No. 50050
Coalition: PSOL / PCB
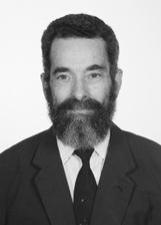
192Lauro Bacca3,3610.09%
REDE · No. 18001

193Gustavo Horst3,3160.09%
Alternate · SOLIDARIEDADE · No. 77777
Coalition: PSB / PRB / SOLIDARIEDADE

194Mari Câmara3,2400.09%
Alternate · PT · No. 13613
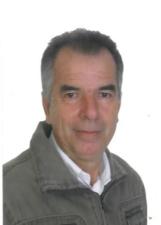
195Caldeira3,1790.09%
Alternate · MDB · No. 15030
Coalition: MDB / PSDB

196Rafael Kretzer3,0890.08%
PMN · No. 33100
Coalition: PMN / PATRIOTA
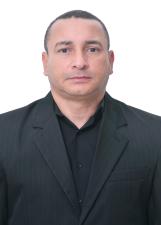
197Sub Mendes3,0870.08%
Alternate · PSL · No. 17047
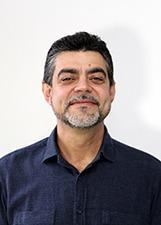
198Wanderlei Monteiro3,0720.08%
Alternate · PT · No. 13302
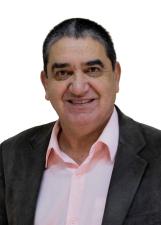
199Amarildo Farias2,8650.08%
Alternate · PT · No. 13012
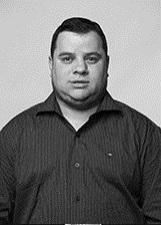
200Cleiton Bittelbrunn2,8290.08%
Alternate · PRP · No. 44444
Coalition: DEM / PROS / PPL / PRP / PV

201Reni Barboza2,8050.08%
Alternate · PDT · No. 12100
Coalition: PC do B / PDT / PHS / PODE
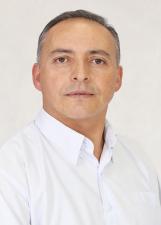
202Edson Padilha2,7890.08%
Alternate · PODE · No. 19234
Coalition: PC do B / PDT / PHS / PODE
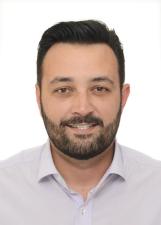
203Daniel Hostin2,7690.08%
Alternate · MDB · No. 15159
Coalition: MDB / PSDB

204Humberto Grossl2,7390.07%
Alternate · PPS · No. 23017
Coalition: PTB / PTC / PRTB / DC / AVANTE / PR / PPS

205Vanessa Carazzo2,7250.07%
Alternate · PSL · No. 17977
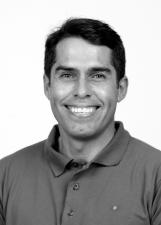
206Tanio Barreto2,6850.07%
Alternate · PROS · No. 90000
Coalition: DEM / PROS / PPL / PRP / PV
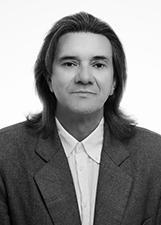
207Tche Mendes2,5820.07%
Alternate · PSB · No. 40455
Coalition: PSB / PRB / SOLIDARIEDADE
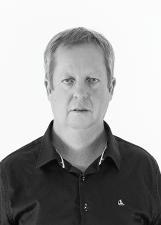
208Manjuva Caminhoneiro2,5390.07%
Alternate · PP · No. 11113
Coalition: PSD / PP / PSC
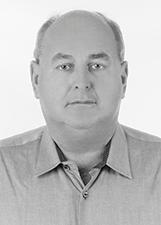
209Rubão (rubens Borchardt)2,5360.07%
Alternate · PT · No. 13111
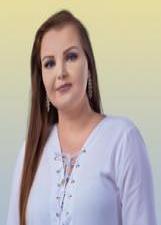
210Erônica Alves2,5200.07%
Alternate · PSL · No. 17289
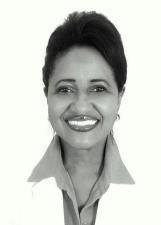
211Edenice Fraga2,5070.07%
REDE · No. 18777

212Marta Vanelli2,4920.07%
Alternate · PT · No. 13313

213Dalva Pichetti2,4210.07%
Alternate · PSD · No. 55655
Coalition: PSD / PP / PSC

214Lucio Mauro2,4030.07%
Alternate · DEM · No. 25125
Coalition: DEM / PROS / PPL / PRP / PV
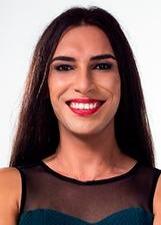
215Mariana Franco2,3030.06%
Alternate · PC do B · No. 65000
Coalition: PC do B / PDT / PHS / PODE
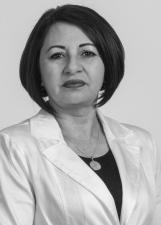
216Aurora Coelho2,1970.06%
Alternate · PT · No. 13713
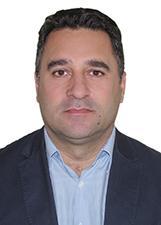
217Rodrigo Cassio2,1720.06%
Alternate · PTC · No. 36123
Coalition: PTB / PTC / PRTB / DC / AVANTE / PR / PPS
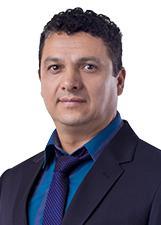
218Nego do Rádio2,1020.06%
Alternate · PSL · No. 17101
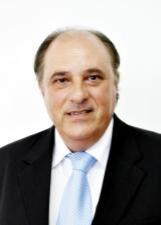
219Dr. Jorge Borghetti2,0670.06%
Alternate · DEM · No. 25101
Coalition: DEM / PROS / PPL / PRP / PV
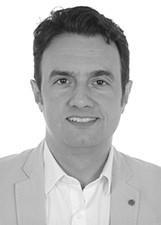
220Jeferson Rocha2,0570.06%
Alternate · DEM · No. 25007
Coalition: DEM / PROS / PPL / PRP / PV
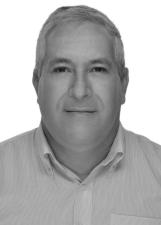
221Sandro Andretti2,0300.06%
Alternate · SOLIDARIEDADE · No. 77000
Coalition: PSB / PRB / SOLIDARIEDADE
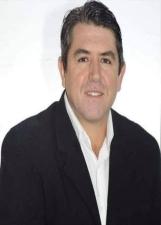
222Belo1,9950.05%
Alternate · SOLIDARIEDADE · No. 77377
Coalition: PSB / PRB / SOLIDARIEDADE
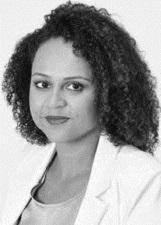
223Pamela Fonseca1,9350.05%
Alternate · PT · No. 13008
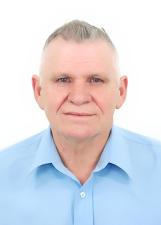
224Furlan1,9260.05%
Alternate · PT · No. 13300
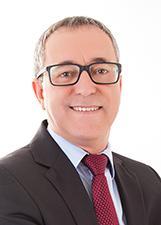
225Ivo Jorge Gandolfi (dr Ivo)1,9190.05%
PATRI · No. 51555
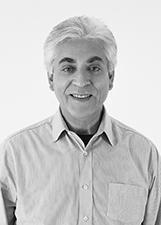
226Salvador dos Santos1,8950.05%
Alternate · PRP · No. 44279
Coalition: DEM / PROS / PPL / PRP / PV
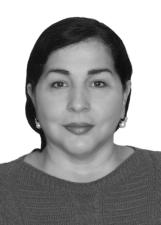
227Márcia da Saude1,8450.05%
Alternate · SOLIDARIEDADE · No. 77555
Coalition: PSB / PRB / SOLIDARIEDADE

228Professor Marcos de Souza1,7480.05%
REDE · No. 18123
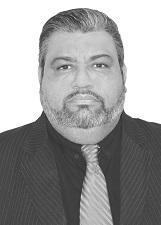
229Robson Pentecoste1,7390.05%
PATRI · No. 51051
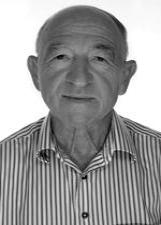
230Aparecido Voltolini Taxista1,7300.05%
Alternate · PPS · No. 23456
Coalition: PTB / PTC / PRTB / DC / AVANTE / PR / PPS

231Michelle Raupp1,6920.05%
Alternate · PSL · No. 17170
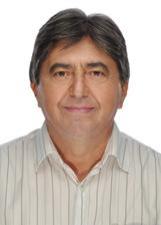
232João José1,6910.05%
Alternate · PT · No. 13101
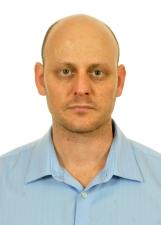
233Thiago Bertola1,6660.05%
Alternate · PP · No. 11007
Coalition: PSD / PP / PSC
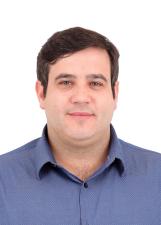
234Fioravante Buch Neto1,6040.04%
Alternate · DEM · No. 25255
Coalition: DEM / PROS / PPL / PRP / PV
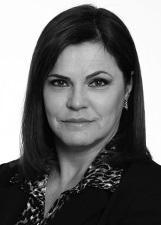
235Neuza Bonilla1,5690.04%
Alternate · PTB · No. 14111
Coalition: PTB / PTC / PRTB / DC / AVANTE / PR / PPS

236Professor Walter Baldi1,5170.04%
Alternate · PTB · No. 14123
Coalition: PTB / PTC / PRTB / DC / AVANTE / PR / PPS
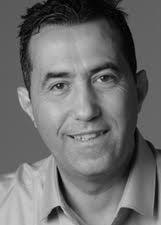
237Roberto da Luz1,5040.04%
Alternate · PDT · No. 12600
Coalition: PC do B / PDT / PHS / PODE
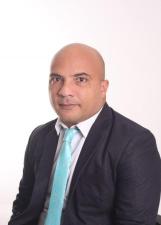
238Marcos Aurélio1,4780.04%
Alternate · SOLIDARIEDADE · No. 77500
Coalition: PSB / PRB / SOLIDARIEDADE

239Pepê1,4480.04%
Alternate · PTB · No. 14193
Coalition: PTB / PTC / PRTB / DC / AVANTE / PR / PPS
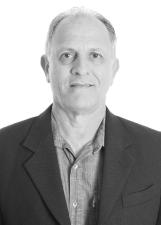
240Odacir Venturi1,3750.04%
Alternate · PRB · No. 10010
Coalition: PSB / PRB / SOLIDARIEDADE

241Eduardo Rodrigues1,3620.04%
PSOL · No. 50055
Coalition: PSOL / PCB
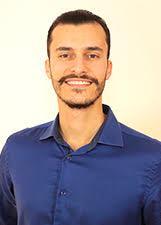
242Anderson Jiraya1,3580.04%
Alternate · PHS · No. 31310
Coalition: PC do B / PDT / PHS / PODE
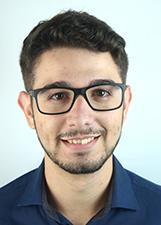
243André Manoel1,3410.04%
PSOL · No. 50500
Coalition: PSOL / PCB
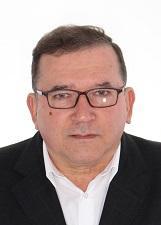
244Francisco Medeiros1,2790.03%
Alternate · PPS · No. 23455
Coalition: PTB / PTC / PRTB / DC / AVANTE / PR / PPS
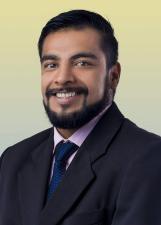
245Milton Muniz1,2520.03%
Alternate · PSL · No. 17877

246Itamar Caon1,2500.03%
Alternate · PSB · No. 40789
Coalition: PSB / PRB / SOLIDARIEDADE

247Tati Melzi1,2420.03%
Alternate · PP · No. 11777
Coalition: PSD / PP / PSC

248Sergio da Farmacia1,2200.03%
PATRI · No. 51757

249Zunino1,2050.03%
Alternate · PT · No. 13131
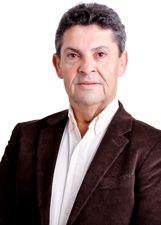
250Beto Prazeres1,1870.03%
Alternate · PTB · No. 14444
Coalition: PTB / PTC / PRTB / DC / AVANTE / PR / PPS
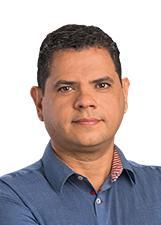
251Cesar Aguiar1,1860.03%
Alternate · PR · No. 22221
Coalition: PTB / PTC / PRTB / DC / AVANTE / PR / PPS

252Bispo Sargento Luiz Alberto1,1770.03%
Alternate · PSC · No. 20190
Coalition: PSD / PP / PSC

253Lucas Ribeiro1,1630.03%
Alternate · PSD · No. 55444
Coalition: PSD / PP / PSC

254Alexandre Gebler1,1440.03%
Alternate · PSDB · No. 45555
Coalition: MDB / PSDB
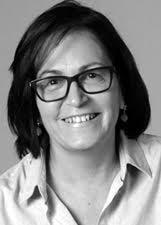
255Janete Teixeira1,1390.03%
Alternate · PDT · No. 12789
Coalition: PC do B / PDT / PHS / PODE
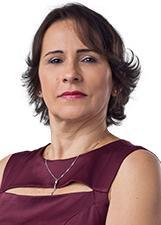
256Cleusa Correa1,1280.03%
Alternate · PSL · No. 17125
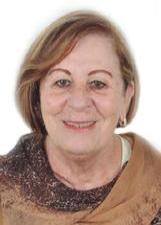
257Arlete Canarinha1,1230.03%
Alternate · PT · No. 13040
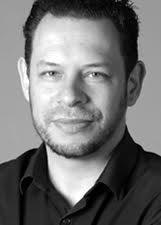
258Jeferson Petri1,0890.03%
Alternate · PDT · No. 12777
Coalition: PC do B / PDT / PHS / PODE
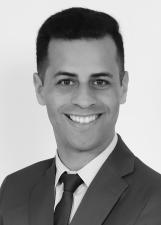
259Carlos Eduardo1,0810.03%
Alternate · PPS · No. 23555
Coalition: PTB / PTC / PRTB / DC / AVANTE / PR / PPS
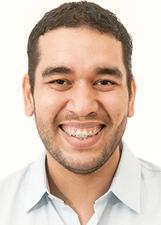
260Alisson Castro1,0770.03%
PSOL · No. 50123
Coalition: PSOL / PCB
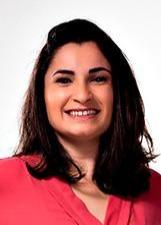
261Fafá Capela1,0660.03%
Alternate · PC do B · No. 65180
Coalition: PC do B / PDT / PHS / PODE
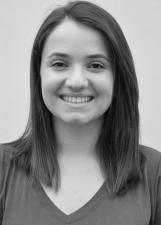
262Mayara1,0580.03%
PSOL · No. 50550
Coalition: PSOL / PCB

263Laércio Ventura1,0250.03%
Alternate · PSB · No. 40321
Coalition: PSB / PRB / SOLIDARIEDADE
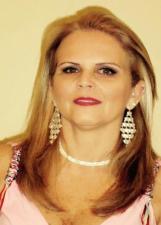
264Zezé Dentista1,0180.03%
Alternate · SOLIDARIEDADE · No. 77051
Coalition: PSB / PRB / SOLIDARIEDADE
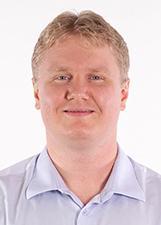
265Carlesso9980.03%
PSOL · No. 50000
Coalition: PSOL / PCB

266Sarah Maciel9560.03%
Alternate · PSDB · No. 45777
Coalition: MDB / PSDB
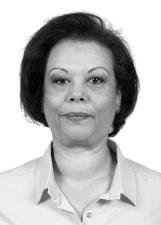
267Angelica Ponciano9560.03%
Alternate · PSDB · No. 45444
Coalition: MDB / PSDB
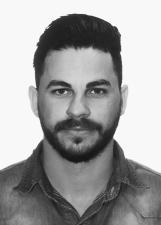
268Marcelo Gomes9480.03%
PMN · No. 33244
Coalition: PMN / PATRIOTA
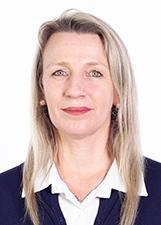
269Jane Acordi9380.03%
PSOL · No. 50456
Coalition: PSOL / PCB

270Janete Couto9310.03%
Alternate · PRP · No. 44567
Coalition: DEM / PROS / PPL / PRP / PV

271Ana Caldas9230.03%
Alternate · PSDB · No. 45005
Coalition: MDB / PSDB

272Nino Mayer9110.02%
PMN · No. 33233
Coalition: PMN / PATRIOTA

273Fernando Lupercio8650.02%
Alternate · PTC · No. 36777
Coalition: PTB / PTC / PRTB / DC / AVANTE / PR / PPS

274Prof. Rosso8650.02%
Alternate · PDT · No. 12667
Coalition: PC do B / PDT / PHS / PODE
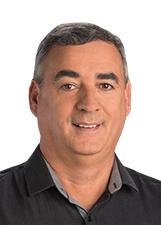
275Iedo della Giustina8520.02%
Alternate · PR · No. 22301
Coalition: PTB / PTC / PRTB / DC / AVANTE / PR / PPS
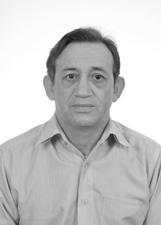
276Jorge Freitas8480.02%
Alternate · PPL · No. 54777
Coalition: DEM / PROS / PPL / PRP / PV

277Ariel Nunes8440.02%
PATRI · No. 51994

278Fachini8370.02%
PATRI · No. 51528
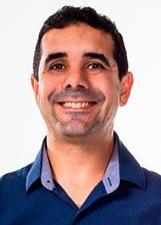
279Professor Fernando8210.02%
Alternate · PC do B · No. 65001
Coalition: PC do B / PDT / PHS / PODE
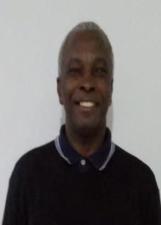
280Orlando (siri)8180.02%
Alternate · PSB · No. 40788
Coalition: PSB / PRB / SOLIDARIEDADE
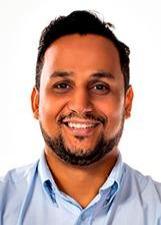
281Flávio Cordeiro8170.02%
Alternate · PC do B · No. 65027
Coalition: PC do B / PDT / PHS / PODE
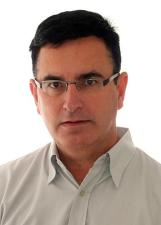
282Nilson Sousa8060.02%
Alternate · PT · No. 13777
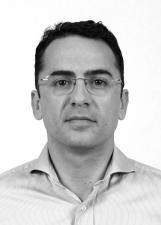
283Valter Jobim7970.02%
Alternate · PSDB · No. 45888
Coalition: MDB / PSDB
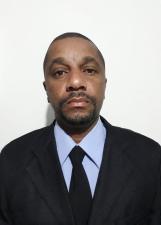
284Alexandre Lopes7970.02%
Alternate · SOLIDARIEDADE · No. 77321
Coalition: PSB / PRB / SOLIDARIEDADE

285Prof. Isabeli7930.02%
Alternate · PSD · No. 55678
Coalition: PSD / PP / PSC

286Luisa do Prado7750.02%
Alternate · PC do B · No. 65099
Coalition: PC do B / PDT / PHS / PODE

287Luiz Costa7720.02%
Alternate · PC do B · No. 65150
Coalition: PC do B / PDT / PHS / PODE
288Mariza Valgas7430.02%
Alternate · DEM · No. 25577
Coalition: DEM / PROS / PPL / PRP / PV

289Lilian Hinnig7220.02%
PMN · No. 33555
Coalition: PMN / PATRIOTA

290Carla Baumer7100.02%
Alternate · DEM · No. 25555
Coalition: DEM / PROS / PPL / PRP / PV
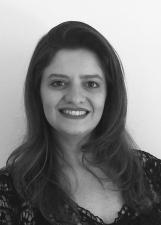
291Thais Martucci7040.02%
Alternate · PRB · No. 10456
Coalition: PSB / PRB / SOLIDARIEDADE
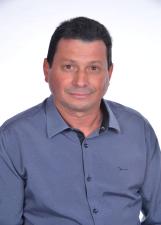
292Antonio Coelho6890.02%
Alternate · PSB · No. 40777
Coalition: PSB / PRB / SOLIDARIEDADE
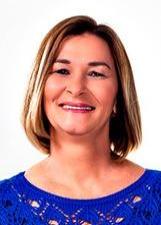
293Angelica Albino6620.02%
Alternate · PC do B · No. 65555
Coalition: PC do B / PDT / PHS / PODE

294Bettina Berbigier6550.02%
REDE · No. 18028
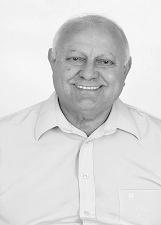
295Aldo Apolinário João6500.02%
Alternate · PODE · No. 19444
Coalition: PC do B / PDT / PHS / PODE
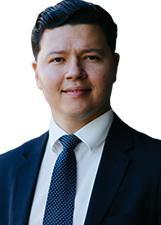
296Ricardo Wippel6350.02%
Alternate · PPS · No. 23423
Coalition: PTB / PTC / PRTB / DC / AVANTE / PR / PPS
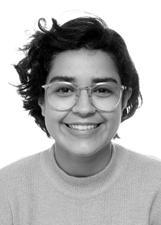
297Rafaela Brito6300.02%
PSTU · No. 16016

298Karin Mollmann6260.02%
Alternate · PSL · No. 17430
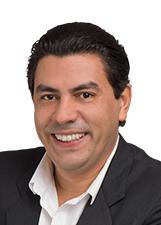
299Hermann Motta6090.02%
Alternate · PR · No. 22048
Coalition: PTB / PTC / PRTB / DC / AVANTE / PR / PPS

300Marcos Mendes6080.02%
PMN · No. 33123
Coalition: PMN / PATRIOTA
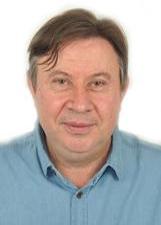
301Célio Hohn6020.02%
Alternate · PC do B · No. 65010
Coalition: PC do B / PDT / PHS / PODE
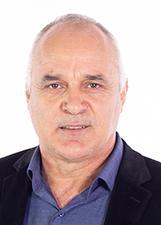
302Gilmar Axé6020.02%
PSOL · No. 50321
Coalition: PSOL / PCB
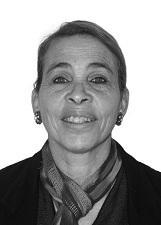
303Claudia da Coloninha6000.02%
Alternate · PRB · No. 10333
Coalition: PSB / PRB / SOLIDARIEDADE
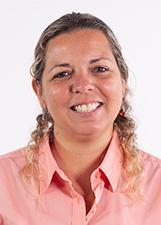
304Maria Fernanda5810.02%
PSOL · No. 50999
Coalition: PSOL / PCB
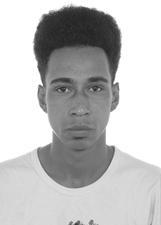
305Dkg Dekilograma5780.02%
PSTU · No. 16123

306Candinha Jorge5670.02%
Alternate · PSD · No. 55553
Coalition: PSD / PP / PSC

307Adir Santos5450.01%
Alternate · PODE · No. 19123
Coalition: PC do B / PDT / PHS / PODE
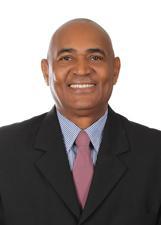
308Everaldo Correa5350.01%
Alternate · PV · No. 43043
Coalition: DEM / PROS / PPL / PRP / PV
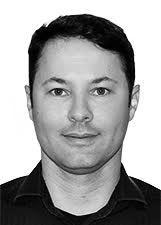
309Vitor Leal Freitas5350.01%
REDE · No. 18888
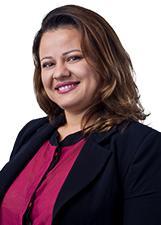
310Jana Marla5270.01%
Alternate · PSL · No. 17127

311Cláudia Bombeira5250.01%
Alternate · PP · No. 11193
Coalition: PSD / PP / PSC
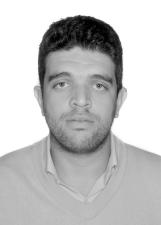
312Maicon Santos5240.01%
Alternate · PRP · No. 44321
Coalition: DEM / PROS / PPL / PRP / PV

313Rosane Machado5180.01%
Alternate · PSD · No. 55855
Coalition: PSD / PP / PSC

314Danilo Novais5120.01%
PSOL · No. 50222
Coalition: PSOL / PCB
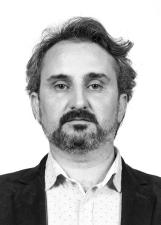
315João Patussi5120.01%
Alternate · PSDB · No. 45545
Coalition: MDB / PSDB
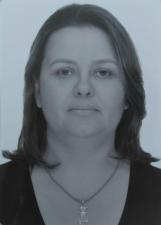
316Policial Ana Paula5040.01%
PATRI · No. 51190
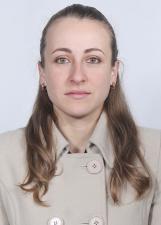
317Kethlin Carraro4870.01%
Alternate · PODE · No. 19789
Coalition: PC do B / PDT / PHS / PODE

318Boca da Içarense4820.01%
Alternate · PRB · No. 10612
Coalition: PSB / PRB / SOLIDARIEDADE
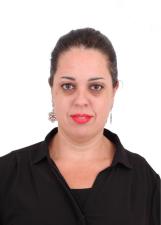
319Gislaine de Pinho4780.01%
Alternate · DEM · No. 25999
Coalition: DEM / PROS / PPL / PRP / PV

320Dayson Waldschmidt4770.01%
REDE · No. 18383

321Gabriela Schaffer4690.01%
REDE · No. 18100
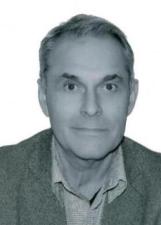
322Rubens Graciolli4610.01%
PMN · No. 33010
Coalition: PMN / PATRIOTA
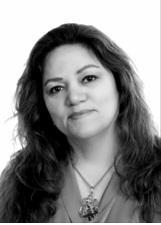
323Raquel Pecatto4470.01%
Alternate · PSB · No. 40555
Coalition: PSB / PRB / SOLIDARIEDADE
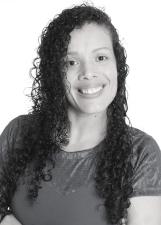
324Professora Luciana4370.01%
Alternate · PODE · No. 19133
Coalition: PC do B / PDT / PHS / PODE
325Roni Manfredi4120.01%
PATRI · No. 51515

326Fernanda Botelho4110.01%
Alternate · PV · No. 43333
Coalition: DEM / PROS / PPL / PRP / PV

327Dodo Vigilante4090.01%
PATRI · No. 51691
328Cidinha4040.01%
PSOL · No. 50121
Coalition: PSOL / PCB
329Grandi3940.01%
PCB · No. 21000
Coalition: PSOL / PCB

330Richard Goterra3830.01%
REDE · No. 18222
331Júlio Sul Livre3820.01%
PMN · No. 33007
Coalition: PMN / PATRIOTA
332Anderson do Raio X3750.01%
PATRI · No. 51500
333Shirlene Cecatto3700.01%
Alternate · SOLIDARIEDADE · No. 77025
Coalition: PSB / PRB / SOLIDARIEDADE
334Marileia Gois364<0.01%
Alternate · PSL · No. 17659
335Eduardo Eto354<0.01%
Alternate · DEM · No. 25047
Coalition: DEM / PROS / PPL / PRP / PV
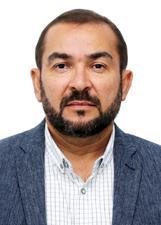
336Sargento Peres336<0.01%
PATRI · No. 51085
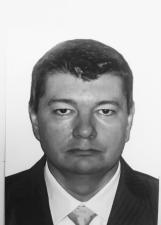
337Cristiano Abelardo333<0.01%
PATRI · No. 51100

338Dra Vanessa326<0.01%
PATRI · No. 51234
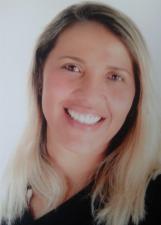
339Carina Cruz326<0.01%
Alternate · DC · No. 27777
Coalition: PTB / PTC / PRTB / DC / AVANTE / PR / PPS
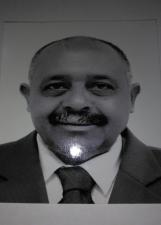
340Professor Chaves315<0.01%
PATRI · No. 51351

341Laura Diés311<0.01%
PATRI · No. 51101

342Dulcianne Borchardt307<0.01%
Alternate · MDB · No. 15888
Coalition: MDB / PSDB
343José Ricardo302<0.01%
Alternate · PRP · No. 44044
Coalition: DEM / PROS / PPL / PRP / PV
344Nilza Martins298<0.01%
Alternate · PR · No. 22122
Coalition: PTB / PTC / PRTB / DC / AVANTE / PR / PPS
345Bismar Conceição295<0.01%
PSOL · No. 50555
Coalition: PSOL / PCB
346Elvira Pierre291<0.01%
Alternate · PSD · No. 55269
Coalition: PSD / PP / PSC
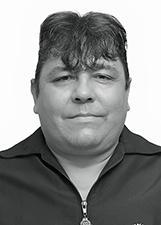
347Cantor Herói290<0.01%
Alternate · PRP · No. 44555
Coalition: DEM / PROS / PPL / PRP / PV
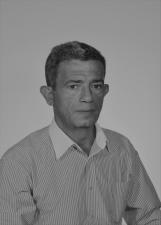
348Valdemar Eletricista285<0.01%
REDE · No. 18000
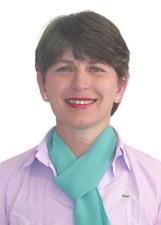
349Orientadora Anelise279<0.01%
Alternate · DC · No. 27027
Coalition: PTB / PTC / PRTB / DC / AVANTE / PR / PPS
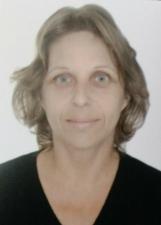
350Taisa Evaristo278<0.01%
Alternate · PV · No. 43013
Coalition: DEM / PROS / PPL / PRP / PV
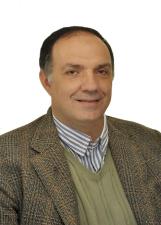
351PR Carlos Varella278<0.01%
Alternate · DC · No. 27000
Coalition: PTB / PTC / PRTB / DC / AVANTE / PR / PPS
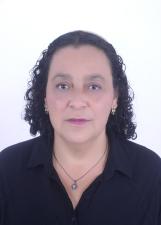
352Cleusa França Dalmolin275<0.01%
Alternate · MDB · No. 15456
Coalition: MDB / PSDB
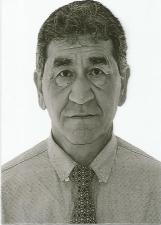
353Darci Chutando Balde272<0.01%
Alternate · PRP · No. 44222
Coalition: DEM / PROS / PPL / PRP / PV

354Ivone Hossa270<0.01%
Alternate · PSC · No. 20222
Coalition: PSD / PP / PSC

355Dirlei Cardozo270<0.01%
Alternate · DEM · No. 25345
Coalition: DEM / PROS / PPL / PRP / PV
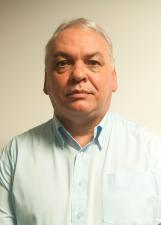
356Arnaldo Napoli259<0.01%
PSOL · No. 50013
Coalition: PSOL / PCB
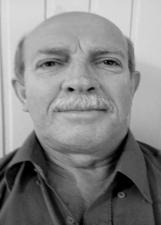
357Jose Carlos Jantsch254<0.01%
PMN · No. 33321
Coalition: PMN / PATRIOTA

358Professora Pimpao253<0.01%
PATRI · No. 51012
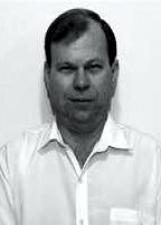
359Lauro Scheel248<0.01%
Alternate · PV · No. 43000
Coalition: DEM / PROS / PPL / PRP / PV
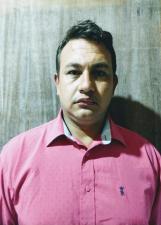
360Altair Mariano245<0.01%
PATRI · No. 51017
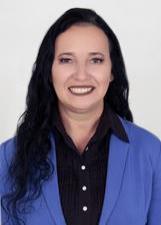
361Silvia Pescadora245<0.01%
Alternate · PP · No. 11555
Coalition: PSD / PP / PSC

362Adriane Nagel Pereira241<0.01%
Alternate · PRB · No. 10022
Coalition: PSB / PRB / SOLIDARIEDADE
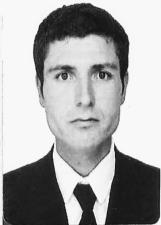
363Missionario Elvio234<0.01%
PATRI · No. 51020
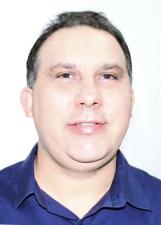
364Fabricio Vieira231<0.01%
Alternate · SOLIDARIEDADE · No. 77877
Coalition: PSB / PRB / SOLIDARIEDADE
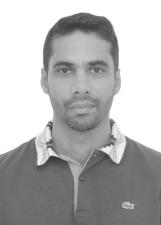
365Joaquim Pizarro229<0.01%
Alternate · AVANTE · No. 70777
Coalition: PTB / PTC / PRTB / DC / AVANTE / PR / PPS
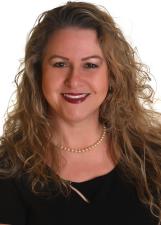
366Izza de Carli228<0.01%
Alternate · MDB · No. 15789
Coalition: MDB / PSDB
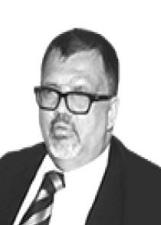
367Leopoldo Barentin224<0.01%
Alternate · PRP · No. 44123
Coalition: DEM / PROS / PPL / PRP / PV

368Adriano Nunes223<0.01%
PATRI · No. 51412

369Fernando Barbosa dos Santos221<0.01%
REDE · No. 18419

370Mariana Rodrigues220<0.01%
Alternate · PP · No. 11125
Coalition: PSD / PP / PSC
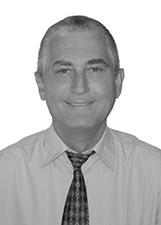
371Alexandre Leite216<0.01%
Alternate · PV · No. 43123
Coalition: DEM / PROS / PPL / PRP / PV
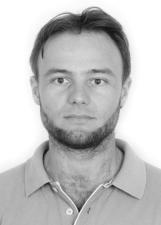
372Deomar213<0.01%
REDE · No. 18022
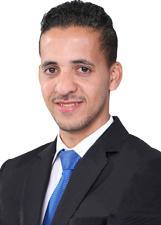
373Emanoel Xavier210<0.01%
Alternate · DC · No. 27123
Coalition: PTB / PTC / PRTB / DC / AVANTE / PR / PPS
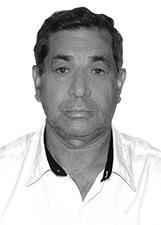
374Pastor Luis Duarte210<0.01%
Alternate · PRTB · No. 28107
Coalition: PTB / PTC / PRTB / DC / AVANTE / PR / PPS
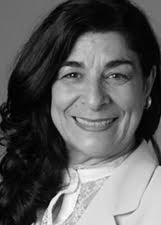
375Edésia Bernardino198<0.01%
Alternate · PDT · No. 12555
Coalition: PC do B / PDT / PHS / PODE
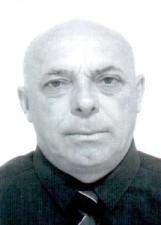
376Dalmir Ventura196<0.01%
PMN · No. 33444
Coalition: PMN / PATRIOTA
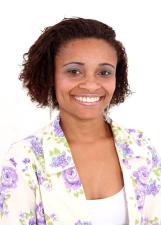
377Karina191<0.01%
Alternate · PSC · No. 20110
Coalition: PSD / PP / PSC

378Elton Moreira178<0.01%
PMN · No. 33310
Coalition: PMN / PATRIOTA
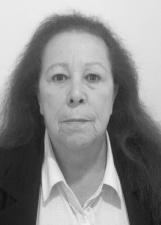
379Maria Inácia173<0.01%
Alternate · PSC · No. 20123
Coalition: PSD / PP / PSC
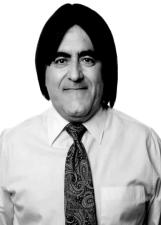
380Queixinho Zacarias168<0.01%
PATRI · No. 51333
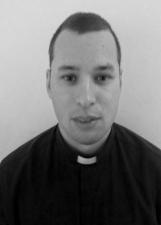
381Dom Ezequiel159<0.01%
PATRI · No. 51606
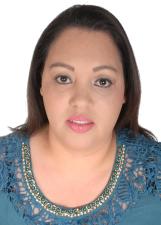
382Elizete Girardi159<0.01%
Alternate · PP · No. 11665
Coalition: PSD / PP / PSC
383Sandra Michels155<0.01%
Alternate · PRP · No. 44018
Coalition: DEM / PROS / PPL / PRP / PV
384Keli Oliveira150<0.01%
Alternate · MDB · No. 15333
Coalition: MDB / PSDB

385Mariane Souza de Albuquerque147<0.01%
PATRI · No. 51889
386José Luz147<0.01%
REDE · No. 18200
387Fernanda Costa146<0.01%
Alternate · PRB · No. 10999
Coalition: PSB / PRB / SOLIDARIEDADE
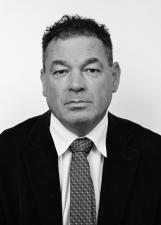
388Gilson Coelho Catinha143<0.01%
Alternate · PRP · No. 44113
Coalition: DEM / PROS / PPL / PRP / PV

389Eliana Albino135<0.01%
Alternate · DEM · No. 25235
Coalition: DEM / PROS / PPL / PRP / PV
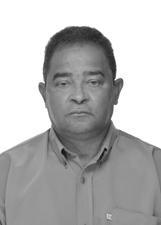
390Waldeni Alves de Lima131<0.01%
Alternate · PRP · No. 44677
Coalition: DEM / PROS / PPL / PRP / PV
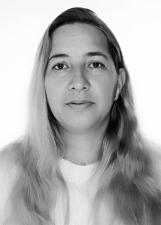
391Elisangela Nóbile131<0.01%
Alternate · SOLIDARIEDADE · No. 77222
Coalition: PSB / PRB / SOLIDARIEDADE
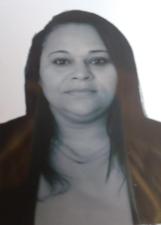
392Joelma Gomes122<0.01%
Alternate · SOLIDARIEDADE · No. 77999
Coalition: PSB / PRB / SOLIDARIEDADE
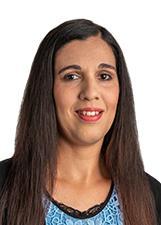
393Deynise Farias116<0.01%
Alternate · PR · No. 22777
Coalition: PTB / PTC / PRTB / DC / AVANTE / PR / PPS
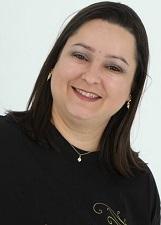
394Yara Garcia116<0.01%
Alternate · MDB · No. 15515
Coalition: MDB / PSDB
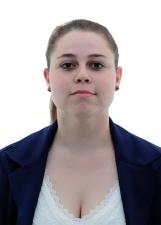
395Daiane Zorrer111<0.01%
Alternate · DEM · No. 25239
Coalition: DEM / PROS / PPL / PRP / PV

396Verônica Pereira110<0.01%
Alternate · PODE · No. 19455
Coalition: PC do B / PDT / PHS / PODE

397Professora Silvana Becker109<0.01%
PATRI · No. 51551

398Ritinha108<0.01%
Alternate · PSB · No. 40440
Coalition: PSB / PRB / SOLIDARIEDADE
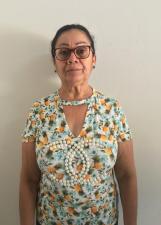
399Tuca Viana101<0.01%
Alternate · PV · No. 43122
Coalition: DEM / PROS / PPL / PRP / PV

400Karina Sinopoli101<0.01%
Alternate · PRP · No. 44999
Coalition: DEM / PROS / PPL / PRP / PV

401Karina Muller100<0.01%
Alternate · DEM · No. 25369
Coalition: DEM / PROS / PPL / PRP / PV
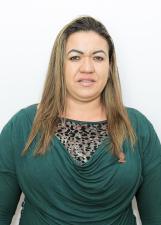
402Tere99<0.01%
PSOL · No. 50155
Coalition: PSOL / PCB

403Lu do PV98<0.01%
Alternate · PV · No. 43210
Coalition: DEM / PROS / PPL / PRP / PV
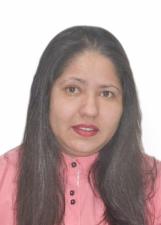
404Simone Oberziner98<0.01%
Alternate · AVANTE · No. 70123
Coalition: PTB / PTC / PRTB / DC / AVANTE / PR / PPS
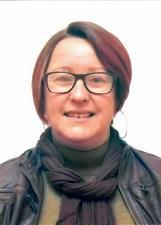
405Sandrinha98<0.01%
Alternate · MDB · No. 15999
Coalition: MDB / PSDB
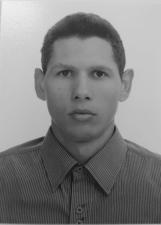
406Saymon Gomes Miranda91<0.01%
PATRI · No. 51033

407Magda Horst89<0.01%
PATRI · No. 51115
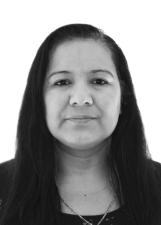
408Michelle Alessandra Marcelino86<0.01%
Alternate · PRP · No. 44888
Coalition: DEM / PROS / PPL / PRP / PV
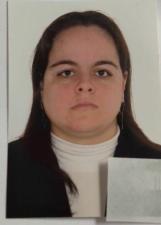
409Priscylla Miguel83<0.01%
Alternate · PSDB · No. 45500
Coalition: MDB / PSDB
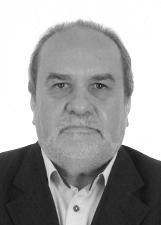
410Elias Silveira83<0.01%
REDE · No. 18188
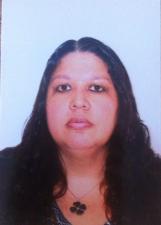
411Arlene Ramon75<0.01%
Alternate · PSDB · No. 45484
Coalition: MDB / PSDB
412Marcia Ibrahim75<0.01%
Alternate · SOLIDARIEDADE · No. 77111
Coalition: PSB / PRB / SOLIDARIEDADE

413Diego Cachorrao72<0.01%
PATRI · No. 51321
414Anderson do Andorinha70<0.01%
PATRI · No. 51777
415Alessandra Magadan64<0.01%
PMN · No. 33001
Coalition: PMN / PATRIOTA
416Nanda Santos63<0.01%
Alternate · PTC · No. 36555
Coalition: PTB / PTC / PRTB / DC / AVANTE / PR / PPS
417Isabel Karin61<0.01%
Alternate · PRTB · No. 28123
Coalition: PTB / PTC / PRTB / DC / AVANTE / PR / PPS

418Gibrair Conte60<0.01%
REDE · No. 18007
419Lawrence Lucca59<0.01%
Alternate · PRP · No. 44022
Coalition: DEM / PROS / PPL / PRP / PV

420Echesler Giovanni Molmelstet57<0.01%
PMN · No. 33500
Coalition: PMN / PATRIOTA
421Luciana Andrade53<0.01%
Alternate · PSB · No. 40005
Coalition: PSB / PRB / SOLIDARIEDADE
422Thamy Vieira53<0.01%
Alternate · MDB · No. 15640
Coalition: MDB / PSDB
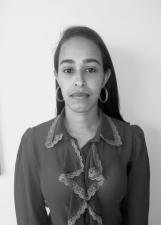
423Daiane dos Santos49<0.01%
PATRI · No. 51010
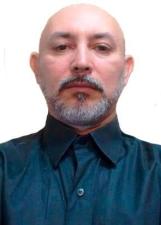
424Sid Superbom47<0.01%
Alternate · DC · No. 27177
Coalition: PTB / PTC / PRTB / DC / AVANTE / PR / PPS
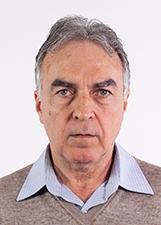
425Nelson Scapini44<0.01%
PSOL · No. 50236
Coalition: PSOL / PCB
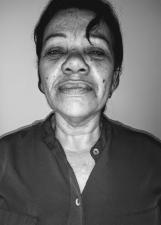
426Rosangela Faria37<0.01%
PATRI · No. 51666
427Sandra Dal Bello27<0.01%
Alternate · PTC · No. 36333
Coalition: PTB / PTC / PRTB / DC / AVANTE / PR / PPS
428Taty20<0.01%
Alternate · PTC · No. 36111
Coalition: PTB / PTC / PRTB / DC / AVANTE / PR / PPS
429Laiana Sales9<0.01%
Alternate · PTC · No. 36222
Coalition: PTB / PTC / PRTB / DC / AVANTE / PR / PPS

430Rita de Cassia Vasconcelos7<0.01%
Alternate · PRP · No. 44183
Coalition: DEM / PROS / PPL / PRP / PV
431Vilson Rodri6<0.01%
Alternate · PRP · No. 44212
Coalition: DEM / PROS / PPL / PRP / PV

—Rabuja16,358
Annulled votesRejected · PSL · No. 17025

—André Luciano Machado1,941
Annulled votesRejected · PSL · No. 17077

—Andrea Monteiro742
Annulled votesRejected · REDE · No. 18212
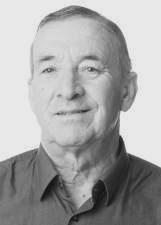
—João Luiz483
Annulled votesRejected · PRP · No. 44100
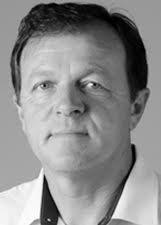
—Darci do Povo311
Annulled votesRejected · PDT · No. 12456
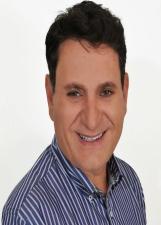
—Paulo Piovezan218
Annulled votesRejected · SOLIDARIEDADE · No. 77177
—Número 12120169
Annulled votesReplaced in the registry · PDT · No. 12120

—Yvytu124
Annulled votesRejected · MDB · No. 15700

—Michel Barros70
Annulled votesRejected, under appeal · PCO · No. 29029
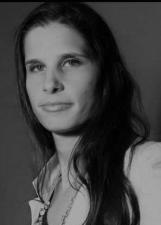
—Raquel Eduardo58
Annulled votesRejected · REDE · No. 18018
—Eliezer Costa15
Annulled votesRejected · PRP · No. 44007


