In 2018, in Paraná, 54 state deputies were elected, according to data from Brazil's Superior Electoral Court (TSE). The largest caucus was that of PSD (6). The most votes went to Alexandre Curi (PSB), with 147,565 votes (2.81% of the valid votes). The electoral quotient was about 97,421 votes, and the lowest vote total among those elected was 21,145: seats are allocated to the party first.

1Alexandre Curi147,5652.81%
Elected · PSB · No. 40128
Coalition: PP / PTB / DEM / PSDB / PSB
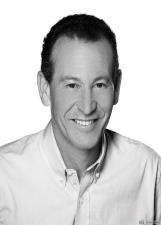
2Professor Lemos84,8921.61%
Elected · PT · No. 13013

3Requião Filho82,6521.57%
Elected · MDB · No. 15151
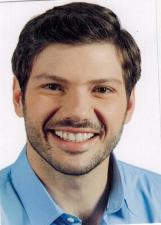
4Tiago Amaral79,4551.51%
Elected · PSB · No. 40123
Coalition: PP / PTB / DEM / PSDB / PSB
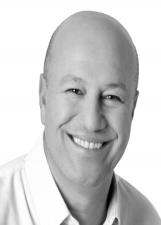
5Romanelli73,3831.39%
Elected · PSB · No. 40678
Coalition: PP / PTB / DEM / PSDB / PSB

6Tadeu Veneri69,3201.32%
Elected · PT · No. 13131
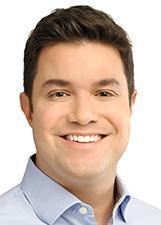
7Guto Silva66,4121.26%
Elected · PSD · No. 55222
Coalition: PSC / PSD
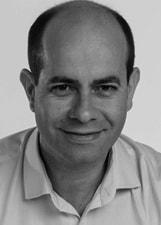
8Evandro Araujo64,7671.23%
Elected · PSC · No. 20120
Coalition: PSC / PSD
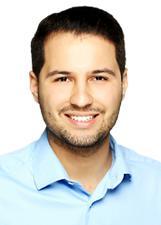
9Paulo Litro61,7911.17%
Elected · PSDB · No. 45160
Coalition: PP / PTB / DEM / PSDB / PSB

10Delegado Jacovos61,3101.17%
Elected · PR · No. 22038
Coalition: PRB / PHS / PR / AVANTE

11Gilberto Ribeiro60,5401.15%
Elected · PP · No. 11590
Coalition: PP / PTB / DEM / PSDB / PSB
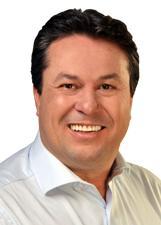
12Marcio Nunes59,1921.13%
Elected · PSD · No. 55250
Coalition: PSC / PSD
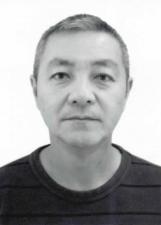
13Coronel Lee58,3431.11%
Elected · PSL · No. 17190
Coalition: PSL / PTC / PATRIOTA

14Artagão Junior57,3851.09%
Elected · PSB · No. 40140
Coalition: PP / PTB / DEM / PSDB / PSB
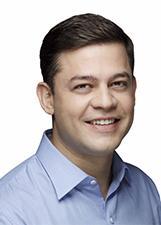
15Tião Medeiros54,2761.03%
Elected · PTB · No. 14789
Coalition: PP / PTB / DEM / PSDB / PSB
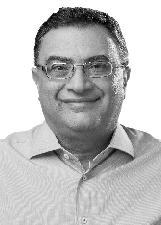
16Michele Caputo51,2460.97%
Elected · PSDB · No. 45000
Coalition: PP / PTB / DEM / PSDB / PSB

17Maria Victoria50,4140.96%
Elected · PP · No. 11511
Coalition: PP / PTB / DEM / PSDB / PSB

18Alexandre Amaro49,5650.94%
Elected · PRB · No. 10123
Coalition: PRB / PHS / PR / AVANTE

19Cristina Silvestri48,8050.93%
Elected · PPS · No. 23121
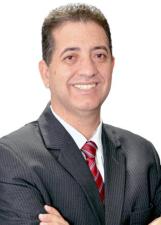
20Cobra Reporter46,9830.89%
Elected · PSD · No. 55055
Coalition: PSC / PSD
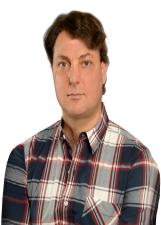
21Anibelli Neto46,7130.89%
Elected · MDB · No. 15190
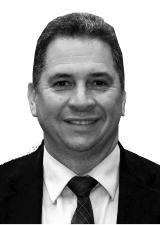
22Gilson de Souza46,1160.88%
Elected · PSC · No. 20044
Coalition: PSC / PSD
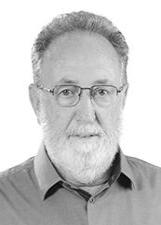
23Tercilio Turini46,1060.88%
Elected · PPS · No. 23043
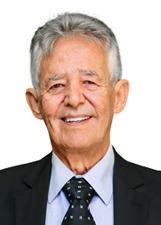
24Luiz Carlos Martins44,0010.84%
Elected · PP · No. 11550
Coalition: PP / PTB / DEM / PSDB / PSB
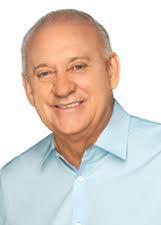
25Traiano43,6010.83%
Elected · PSDB · No. 45789
Coalition: PP / PTB / DEM / PSDB / PSB
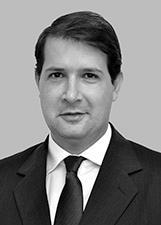
26Marcel Micheletto43,1770.82%
Elected · PR · No. 22000
Coalition: PRB / PHS / PR / AVANTE
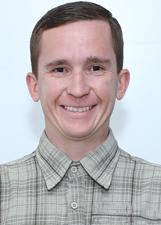
27Estacho43,0880.82%
Elected · PV · No. 43042

28Homero Marchese42,1540.80%
Elected · PROS · No. 90789
Coalition: PROS / PMB / PMN
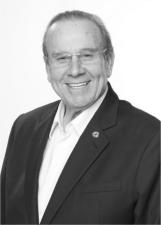
29Jonas Guimarães41,9190.80%
Elected · PSB · No. 40250
Coalition: PP / PTB / DEM / PSDB / PSB

30Douglas Fabrício40,7630.77%
Elected · PPS · No. 23600
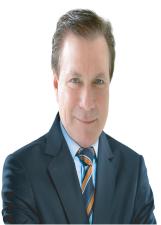
31Mauro Moraes39,5760.75%
Elected · PSD · No. 55655
Coalition: PSC / PSD

32Boca Aberta Junior39,4950.75%
Elected · PRTB · No. 28011
Coalition: PRTB / PRP

33Marcio Pacheco39,3230.75%
Elected · PPL · No. 54100
Coalition: REDE / DC / PPL
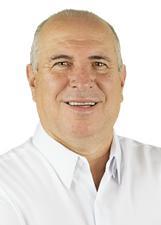
34Francisco Buhrer38,8730.74%
Elected · PSD · No. 55123
Coalition: PSC / PSD

35Nelson Justus38,3490.73%
Elected · DEM · No. 25111
Coalition: PP / PTB / DEM / PSDB / PSB
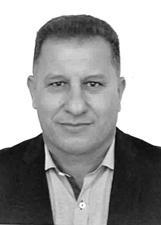
36Adelino Ribeiro37,8350.72%
Elected (remainder seat) · PRP · No. 44800
Coalition: PRTB / PRP

37Goura37,3660.71%
Elected · PDT · No. 12108
Coalition: PDT / SOLIDARIEDADE / PC do B
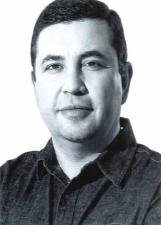
38Delegado Fernando36,9370.70%
Elected · PSL · No. 17025
Coalition: PSL / PTC / PATRIOTA
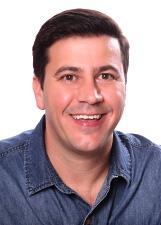
39Arilson Maroldi Chiorato36,4940.69%
Elected · PT · No. 13000
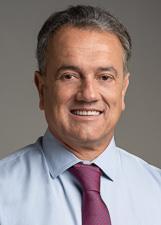
40Plauto36,3320.69%
Elected · DEM · No. 25110
Coalition: PP / PTB / DEM / PSDB / PSB

41Reichembach35,7510.68%
Elected · PSC · No. 20012
Coalition: PSC / PSD
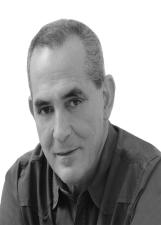
42Nereu Moura35,4790.67%
Elected (remainder seat) · MDB · No. 15178

43Delegado Recalcatti35,3480.67%
Elected · PSD · No. 55555
Coalition: PSC / PSD
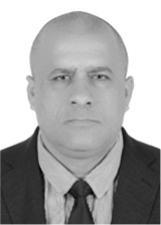
44Soldado Fruet35,2310.67%
Elected · PROS · No. 90181
Coalition: PROS / PMB / PMN
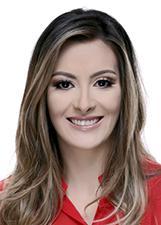
45Mabel Canto35,0360.67%
Elected (remainder seat) · PSC · No. 20100
Coalition: PSC / PSD
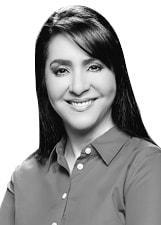
46Cantora Mara Lima33,8660.64%
Alternate · PSC · No. 20123
Coalition: PSC / PSD
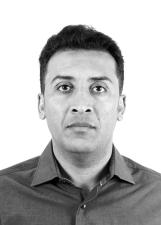
47Soldado Adriano Jose33,7570.64%
Elected · PV · No. 43900
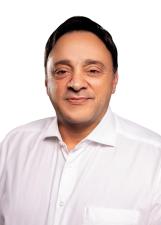
48Hussein Bakri32,6790.62%
Alternate · PSD · No. 55888
Coalition: PSC / PSD
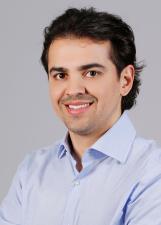
49Luiz Fernando Guerra32,2160.61%
Elected · PSL · No. 17017
Coalition: PSL / PTC / PATRIOTA
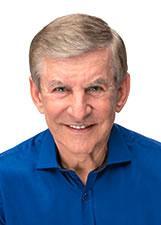
50Elio Rusch32,0010.61%
Elected (remainder seat) · DEM · No. 25155
Coalition: PP / PTB / DEM / PSDB / PSB
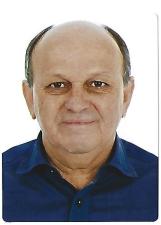
51Dr. Batista31,3150.60%
Elected (remainder seat) · PMN · No. 33014
Coalition: PROS / PMB / PMN
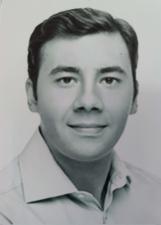
52Evandro Junior31,2000.59%
Alternate · PSDB · No. 45456
Coalition: PP / PTB / DEM / PSDB / PSB
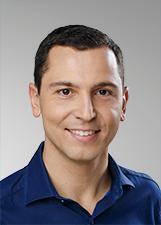
53Pier31,1580.59%
Alternate · PTB · No. 14128
Coalition: PP / PTB / DEM / PSDB / PSB
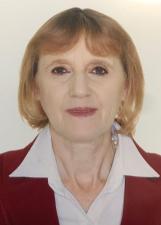
54Luciana Rafagnin30,9310.59%
Elected · PT · No. 13233
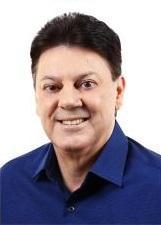
55Nelson Luersen28,8770.55%
Elected · PDT · No. 12680
Coalition: PDT / SOLIDARIEDADE / PC do B
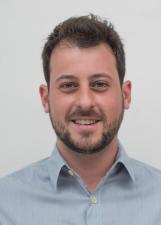
56Natan Sperafico28,8580.55%
Alternate · PP · No. 11223
Coalition: PP / PTB / DEM / PSDB / PSB

57Missionário Ricardo Arruda27,5740.52%
Elected (remainder seat) · PSL · No. 17123
Coalition: PSL / PTC / PATRIOTA
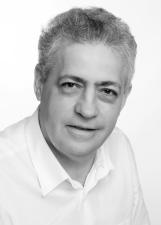
58Péricles de Holleben Mello27,3970.52%
Alternate · PT · No. 13115
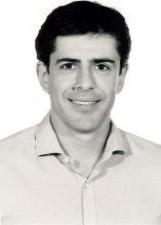
59Andre Bueno26,9550.51%
Alternate · PSDB · No. 45045
Coalition: PP / PTB / DEM / PSDB / PSB

60Dr Zeca26,8870.51%
Alternate · PPS · No. 23456
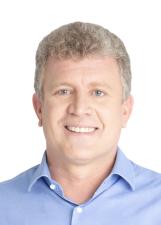
61Paulo Deola26,6760.51%
Alternate · PP · No. 11111
Coalition: PP / PTB / DEM / PSDB / PSB
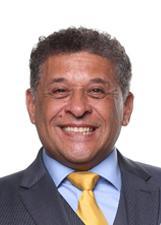
62Galo26,2100.50%
Elected · PODE · No. 19222

63Ademir Bier26,0150.49%
Alternate · PSD · No. 55000
Coalition: PSC / PSD

64Alisson Wandscheer25,3860.48%
Alternate · PMB · No. 35123
Coalition: PROS / PMB / PMN
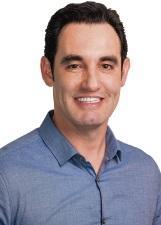
65Alexandre Guimarães25,3000.48%
Alternate · PSD · No. 55255
Coalition: PSC / PSD

66Luis Corti24,4510.46%
Alternate · PSC · No. 20789
Coalition: PSC / PSD
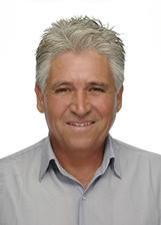
67Gibson24,3950.46%
Alternate · PODE · No. 19500
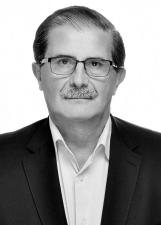
68Professor João Carlos Gomes24,0140.46%
Alternate · PP · No. 11222
Coalition: PP / PTB / DEM / PSDB / PSB

69Samuel Dantas23,8730.45%
Alternate · PSB · No. 40190
Coalition: PP / PTB / DEM / PSDB / PSB

70Flavio Mantovani23,6930.45%
Alternate · PPS · No. 23001
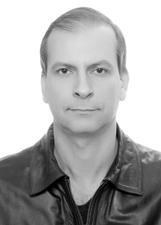
71Professor Euler23,6710.45%
Alternate · PSD · No. 55012
Coalition: PSC / PSD
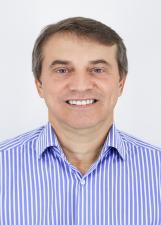
72Beto Lunitti22,7880.43%
Alternate · MDB · No. 15115
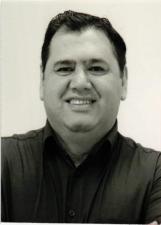
73Dr. Antenor22,6930.43%
Alternate · PT · No. 13500
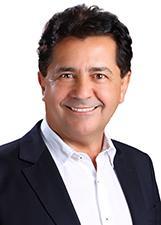
74Claudio Palozi22,6910.43%
Alternate · PSC · No. 20888
Coalition: PSC / PSD

75Luiz Hauly Filho22,4300.43%
Alternate · PSDB · No. 45345
Coalition: PP / PTB / DEM / PSDB / PSB

76Claudia Pereira22,4280.43%
Alternate · PSC · No. 20111
Coalition: PSC / PSD
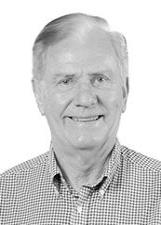
77Felipe Lucas22,2300.42%
Alternate · PPS · No. 23500
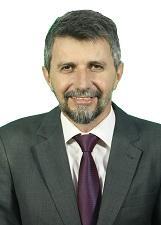
78Nilton Bobato22,2000.42%
Alternate · PC do B · No. 65650
Coalition: PDT / SOLIDARIEDADE / PC do B
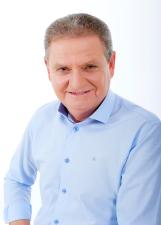
79Eduardo Pasquini21,8380.42%
Alternate · PSD · No. 55550
Coalition: PSC / PSD

80Gugu Bueno21,5740.41%
Alternate · PR · No. 22022
Coalition: PRB / PHS / PR / AVANTE
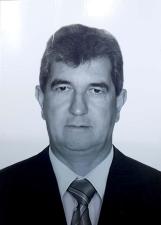
81Pedro Paulo Bazana21,1450.40%
Elected (remainder seat) · PV · No. 43600
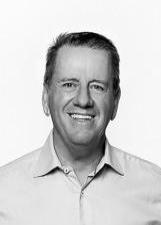
82Mauricio Gehlen21,0180.40%
Alternate · PV · No. 43123
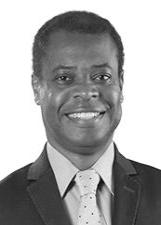
83Herivelto Oliveira20,7950.40%
Alternate · PPS · No. 23444

84Marcello Richa20,0210.38%
Alternate · PSDB · No. 45123
Coalition: PP / PTB / DEM / PSDB / PSB
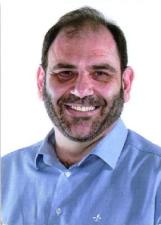
85Mario Verri19,3290.37%
Alternate · PT · No. 13300

86Zampier19,2160.37%
Alternate · PR · No. 22222
Coalition: PRB / PHS / PR / AVANTE

87Tita Furlan18,9230.36%
Alternate · PV · No. 43100
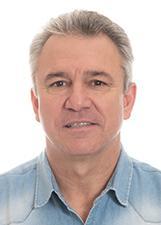
88Professor Sergio18,5130.35%
Alternate · PSD · No. 55456
Coalition: PSC / PSD

89Phelipe Mansur18,3760.35%
Alternate · PSDB · No. 45111
Coalition: PP / PTB / DEM / PSDB / PSB

90Dr. Marcos Ceschin18,0000.34%
Alternate · PSD · No. 55100
Coalition: PSC / PSD
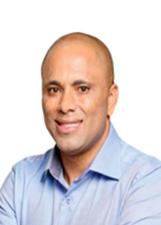
91Do Carmo17,6950.34%
Alternate · PSL · No. 17222
Coalition: PSL / PTC / PATRIOTA

92Emerson Bacil17,6260.34%
Alternate · PSL · No. 17111
Coalition: PSL / PTC / PATRIOTA

93Alceuzinho Maron17,4250.33%
Alternate · PROS · No. 90000
Coalition: PROS / PMB / PMN

94Marco Setim17,3410.33%
Alternate · PROS · No. 90456
Coalition: PROS / PMB / PMN

95Flavio Ferrari Faca Na Bota17,3270.33%
Alternate · PSC · No. 20777
Coalition: PSC / PSD
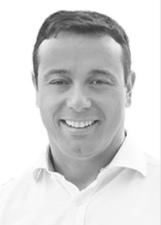
96Cristiano Santos17,3040.33%
Alternate · PV · No. 43190
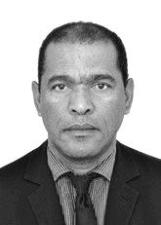
97Policial Madril16,9510.32%
Alternate · PMB · No. 35190
Coalition: PROS / PMB / PMN
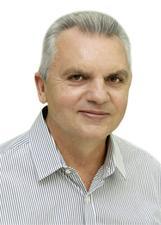
98Ricardo Maia16,3940.31%
Alternate · PODE · No. 19789

99Professor Marcelo16,3120.31%
Alternate · REDE · No. 18400
Coalition: REDE / DC / PPL

100Zé Alexandre16,1390.31%
Alternate · PP · No. 11147
Coalition: PP / PTB / DEM / PSDB / PSB
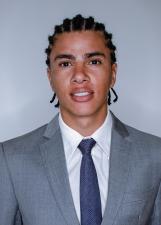
101Renato Freitas15,6630.30%
Alternate · PT · No. 13123

102Wilson Quinteiro15,4910.29%
Alternate · PSDB · No. 45145
Coalition: PP / PTB / DEM / PSDB / PSB
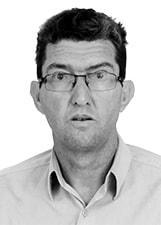
103Pó Royal15,1160.29%
Alternate · PSC · No. 20000
Coalition: PSC / PSD
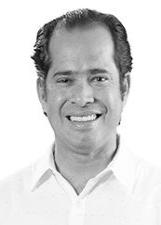
104Marcelo Adriano14,7970.28%
Alternate · PPS · No. 23123

105Karime Fayad14,1190.27%
Alternate · PRB · No. 10112
Coalition: PRB / PHS / PR / AVANTE

106Sergio do Cristma13,4450.26%
Alternate · PV · No. 43013
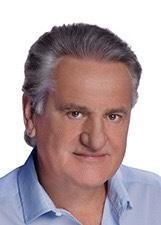
107Sabino Picolo13,2460.25%
Alternate · DEM · No. 25625
Coalition: PP / PTB / DEM / PSDB / PSB
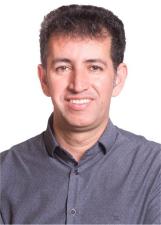
108Marcos Vieira13,1040.25%
Alternate · PDT · No. 12311
Coalition: PDT / SOLIDARIEDADE / PC do B

109Felipe Braga Cortes13,0750.25%
Alternate · PSD · No. 55500
Coalition: PSC / PSD

110Marquinhos Roque13,0510.25%
Alternate · PODE · No. 19123

111Sargento Tania Guerreiro13,0000.25%
Alternate · PRTB · No. 28190
Coalition: PRTB / PRP
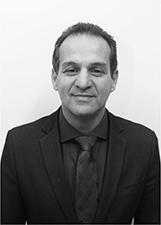
112Ezequias Barros12,7140.24%
Alternate · PRP · No. 44744
Coalition: PRTB / PRP

113Andre Trindade12,2820.23%
Alternate · PPS · No. 23333

114Bruno Pessuti12,2740.23%
Alternate · PSD · No. 55130
Coalition: PSC / PSD
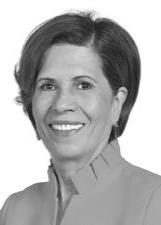
115Elza Correia12,2660.23%
Alternate · PPS · No. 23321
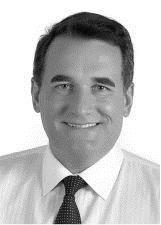
116Tico Kuzma12,2080.23%
Alternate · PROS · No. 90156
Coalition: PROS / PMB / PMN
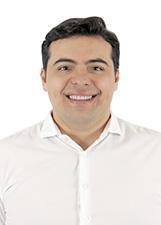
117Misael Junior12,1950.23%
Alternate · PSC · No. 20180
Coalition: PSC / PSD
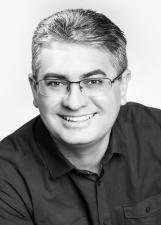
118Julio Kuller11,9450.23%
Alternate · MDB · No. 15015

119Dr Cid Ferreira11,7830.22%
Alternate · PV · No. 43043
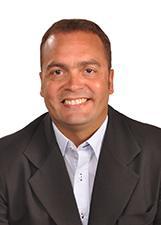
120Marcinho11,6000.22%
Alternate · PDT · No. 12500
Coalition: PDT / SOLIDARIEDADE / PC do B
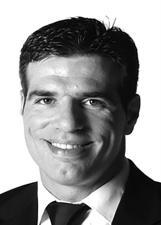
121Paulo Rink11,3640.22%
Alternate · PR · No. 22011
Coalition: PRB / PHS / PR / AVANTE
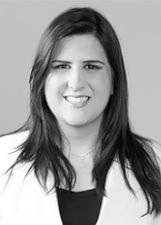
122Dra. Andreza Albuquerque11,1660.21%
Alternate · PSD · No. 55300
Coalition: PSC / PSD
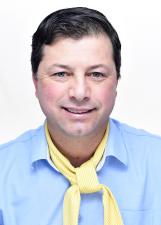
123Artidor Soares11,0220.21%
Alternate · PROS · No. 90090
Coalition: PROS / PMB / PMN
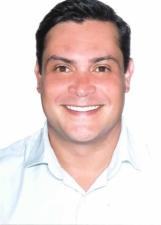
124Cassiano Caron10,9810.21%
Alternate · PSL · No. 17000
Coalition: PSL / PTC / PATRIOTA
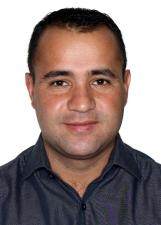
125Sargento Aleixo10,9340.21%
Alternate · DC · No. 27190
Coalition: REDE / DC / PPL
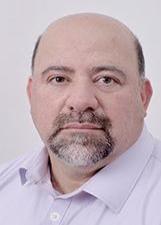
126Dr. Nassib10,8970.21%
Alternate · PMN · No. 33777
Coalition: PROS / PMB / PMN
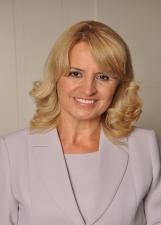
127Noemia Rocha10,4420.20%
Alternate · MDB · No. 15007

128Junior Santos Rosa10,4270.20%
Alternate · PSD · No. 55620
Coalition: PSC / PSD

129Cir Albieri10,1070.19%
Alternate · PV · No. 43700
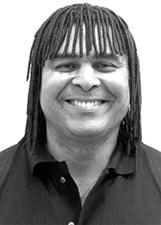
130Mestre Pop10,0790.19%
Alternate · PSC · No. 20020
Coalition: PSC / PSD
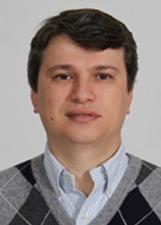
131Dr Magno10,0650.19%
Alternate · PDT · No. 12000
Coalition: PDT / SOLIDARIEDADE / PC do B
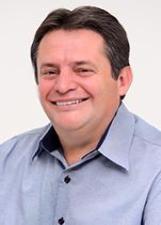
132Aires Tomazoni9,6160.18%
Alternate · MDB · No. 15222
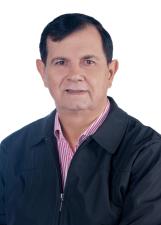
133Chico da Princesa9,4090.18%
Alternate · PDT · No. 12700
Coalition: PDT / SOLIDARIEDADE / PC do B
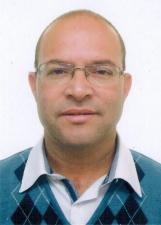
134Professor Abelino8,6380.16%
Alternate · PSB · No. 40500
Coalition: PP / PTB / DEM / PSDB / PSB
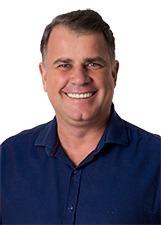
135Mauricio Rivabem8,5740.16%
Alternate · DEM · No. 25000
Coalition: PP / PTB / DEM / PSDB / PSB

136Carla Pimentel8,4950.16%
Alternate · PSC · No. 20007
Coalition: PSC / PSD
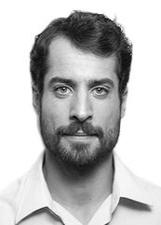
137Diogo Busse8,2310.16%
Alternate · PPS · No. 23000
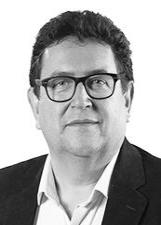
138Mauricio Lense8,0990.15%
Alternate · PPS · No. 23023

139Roseli Isidoro7,9080.15%
Alternate · PDT · No. 12345
Coalition: PDT / SOLIDARIEDADE / PC do B
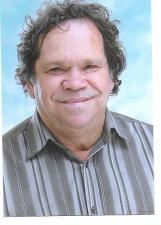
140Bravim7,8980.15%
Alternate · PP · No. 11900
Coalition: PP / PTB / DEM / PSDB / PSB

141Elizeu Liberato7,8190.15%
Alternate · PR · No. 22220
Coalition: PRB / PHS / PR / AVANTE
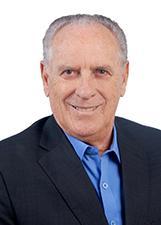
142Pedro Claro7,7010.15%
Alternate · PSD · No. 55111
Coalition: PSC / PSD
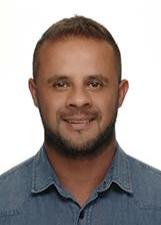
143Prof. Klecius7,6960.15%
Alternate · PMN · No. 33444
Coalition: PROS / PMB / PMN
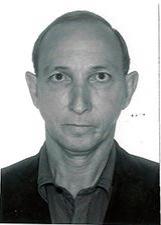
144Dirceu Moreira7,3490.14%
Alternate · PRP · No. 44100
Coalition: PRTB / PRP
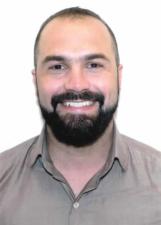
145Felipe Juliani7,0370.13%
Alternate · PSL · No. 17200
Coalition: PSL / PTC / PATRIOTA
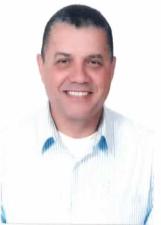
146Coronel Nerino7,0060.13%
Alternate · PSL · No. 17001
Coalition: PSL / PTC / PATRIOTA

147Daniela Ziober6,9650.13%
Alternate · PP · No. 11000
Coalition: PP / PTB / DEM / PSDB / PSB
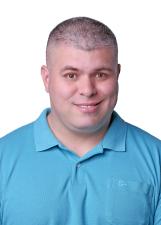
148Leandro da Academia6,9570.13%
Alternate · PV · No. 43300
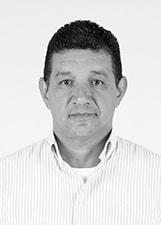
149Waldir Leite6,7580.13%
Alternate · PSC · No. 20122
Coalition: PSC / PSD
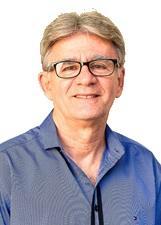
150Benê Filho6,6800.13%
Alternate · PODE · No. 19900

151Guto Klosowski6,6700.13%
Alternate · PHS · No. 31031
Coalition: PRB / PHS / PR / AVANTE
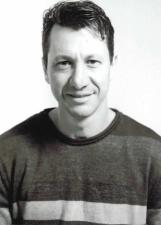
152Kleber Santini6,3270.12%
Alternate · PSL · No. 17999
Coalition: PSL / PTC / PATRIOTA
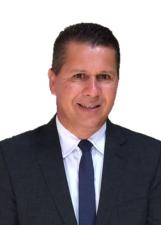
153Miguel Messias6,2210.12%
Alternate · PSL · No. 17077
Coalition: PSL / PTC / PATRIOTA

154Marcos Traad6,1850.12%
Alternate · PSDB · No. 45245
Coalition: PP / PTB / DEM / PSDB / PSB
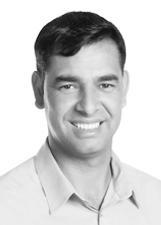
155Xandao6,1240.12%
Alternate · PSL · No. 17027
Coalition: PSL / PTC / PATRIOTA
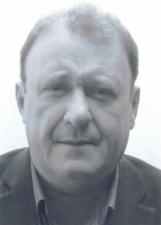
156Alborghetti6,0650.12%
Alternate · PSL · No. 17147
Coalition: PSL / PTC / PATRIOTA

157Professora Ana Novais5,9690.11%
Alternate · PPL · No. 54500
Coalition: REDE / DC / PPL
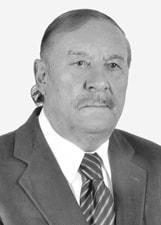
158Dirceu Manfrinato5,9510.11%
Alternate · AVANTE · No. 70199
Coalition: PRB / PHS / PR / AVANTE

159Samuel Pinheiro5,8850.11%
Alternate · PRB · No. 10012
Coalition: PRB / PHS / PR / AVANTE
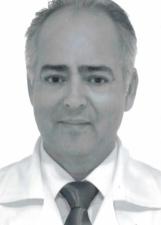
160Professor Galdino5,8680.11%
Alternate · PSL · No. 17021
Coalition: PSL / PTC / PATRIOTA
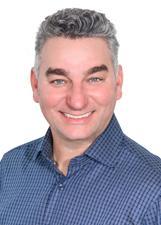
161Professor Josimar Fróes5,8570.11%
Alternate · PODE · No. 19700

162Fran - A Menina da Janela5,7920.11%
Alternate · PRP · No. 44019
Coalition: PRTB / PRP
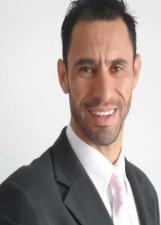
163Professor Daniel Garcia5,7640.11%
Alternate · PODE · No. 19119
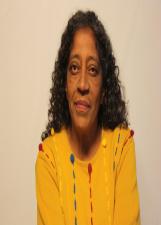
164Dra. Alaerte Martins5,6560.11%
Alternate · PT · No. 13513
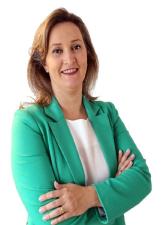
165Karla Maria Tureck5,6150.11%
Alternate · PODE · No. 19800
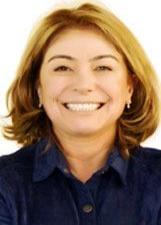
166Maria Leticia Fagundes5,4920.10%
Alternate · PV · No. 43181

167Alex Rato5,4920.10%
Alternate · PSD · No. 55999
Coalition: PSC / PSD
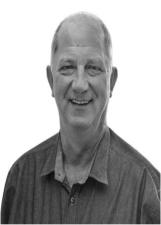
168Valdir Berckemback5,4760.10%
Alternate · PRB · No. 10010
Coalition: PRB / PHS / PR / AVANTE

169Tio Douglas5,4530.10%
Alternate · PTB · No. 14567
Coalition: PP / PTB / DEM / PSDB / PSB

170Odilon Burgath5,4330.10%
Alternate · PDT · No. 12012
Coalition: PDT / SOLIDARIEDADE / PC do B
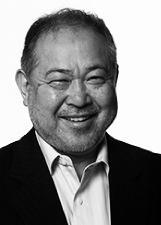
171Professor Matsuda5,3820.10%
Alternate · PPL · No. 54800
Coalition: REDE / DC / PPL

172Mauro Bobato5,3190.10%
Alternate · PODE · No. 19000

173Roberto de Souza5,3130.10%
Alternate · PT · No. 13813
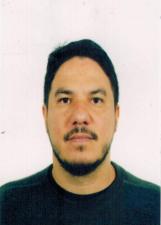
174Neto Gnatta5,2370.10%
Alternate · PSB · No. 40120
Coalition: PP / PTB / DEM / PSDB / PSB
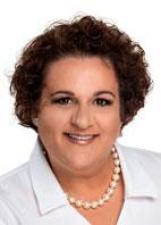
175Margot Jung5,2190.10%
Alternate · PT · No. 13600
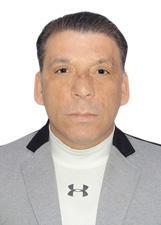
176PR Luiz Alsione / O Mascara5,2100.10%
Alternate · PSC · No. 20222
Coalition: PSC / PSD

177Pastor Sandro Martins5,1480.10%
Alternate · PV · No. 43333
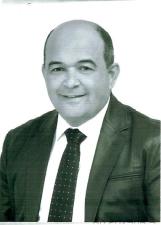
178Odair Fogueteiro5,0950.10%
Alternate · PHS · No. 31789
Coalition: PRB / PHS / PR / AVANTE
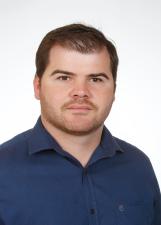
179Wesley Araujo4,9880.09%
Alternate · PR · No. 22123
Coalition: PRB / PHS / PR / AVANTE
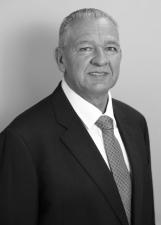
180Tonhao da Saúde4,9430.09%
Alternate · PSD · No. 55155
Coalition: PSC / PSD
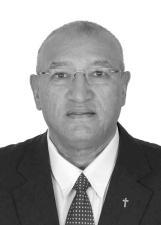
181Padre Roque4,9340.09%
Alternate · PR · No. 22369
Coalition: PRB / PHS / PR / AVANTE
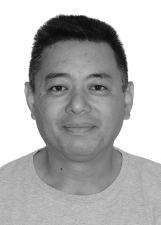
182Eduardo Saçaki4,8570.09%
Alternate · PSD · No. 55089
Coalition: PSC / PSD
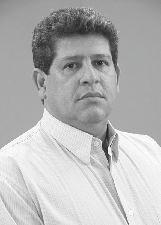
183Marcelo Urbaneja4,8100.09%
Alternate · PP · No. 11333
Coalition: PP / PTB / DEM / PSDB / PSB
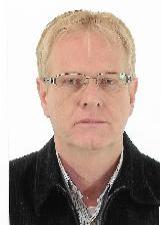
184Geninho Eugenio4,7820.09%
Alternate · PP · No. 11181
Coalition: PP / PTB / DEM / PSDB / PSB
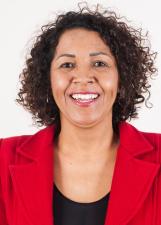
185Edna Dantas4,7290.09%
Alternate · PT · No. 13133

186Paulo Demchuk4,6340.09%
Alternate · PROS · No. 90190
Coalition: PROS / PMB / PMN

187Natal Reis4,5930.09%
Alternate · PPS · No. 23455
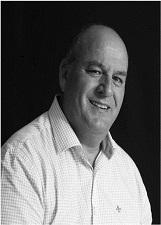
188Silvio Teixeira4,5870.09%
Alternate · PRB · No. 10777
Coalition: PRB / PHS / PR / AVANTE

189Professor Cícero4,5760.09%
Alternate · PT · No. 13113
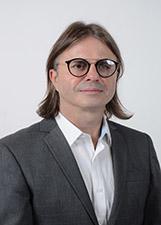
190Jairo Dalla Valle4,5070.09%
Alternate · PRTB · No. 28335
Coalition: PRTB / PRP

191Dr Calixto4,3760.08%
Alternate · PR · No. 22122
Coalition: PRB / PHS / PR / AVANTE
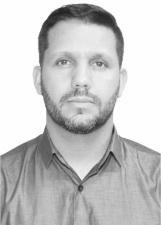
192Guilherme da Rádio4,3740.08%
Alternate · PATRI · No. 51234
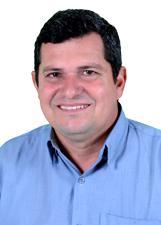
193Mauro Knorst4,3270.08%
Alternate · PRB · No. 10800
Coalition: PRB / PHS / PR / AVANTE
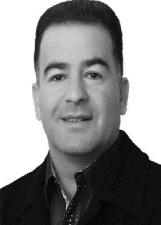
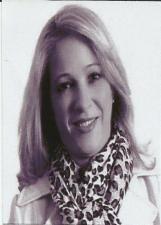
194Joel Cordeiro4,2060.08%
Alternate · PODE · No. 19999
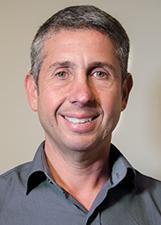
195Aristides Athayde4,1810.08%
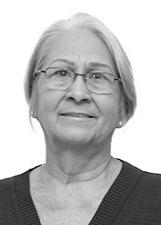
Alternate · PV · No. 43210
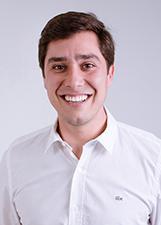
196Joao Geraldo Barros4,1410.08%
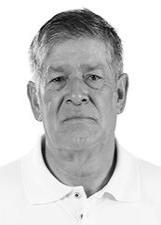
Alternate · PSC · No. 20121
Coalition: PSC / PSD
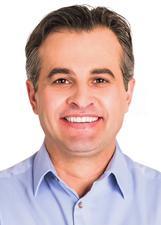
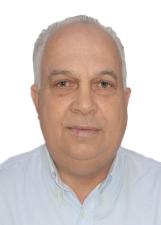
197Ito Oliveira4,0970.08%
Alternate · PV · No. 43000
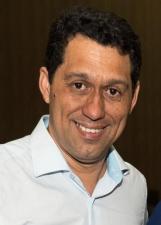
198Gessani3,9650.08%
Alternate · PP · No. 11011
Coalition: PP / PTB / DEM / PSDB / PSB

199Vinícius Camargo3,9290.07%
Alternate · PMB · No. 35144
Coalition: PROS / PMB / PMN

200Cabo Pina3,9120.07%
Alternate · PV · No. 43911
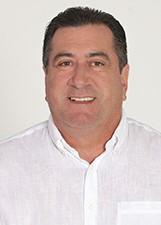
201Tarcisio3,8870.07%
Alternate · PSDB · No. 45678
Coalition: PP / PTB / DEM / PSDB / PSB
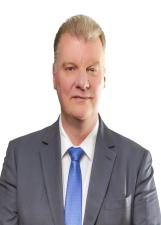
202Osmair Javorosky3,8500.07%
Alternate · PDT · No. 12333
Coalition: PDT / SOLIDARIEDADE / PC do B
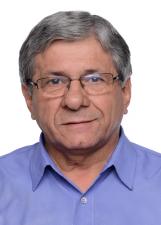
203João Mendonça3,8320.07%
Alternate · MDB · No. 15240
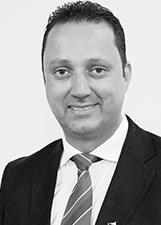
204George3,8250.07%
Alternate · PMN · No. 33333
Coalition: PROS / PMB / PMN
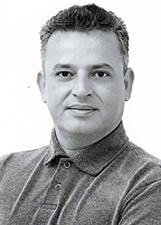
205Jamil Abu3,7450.07%
Alternate · PRP · No. 44000
Coalition: PRTB / PRP

206Rodrigo Ducatti3,7340.07%
Alternate · PP · No. 11555
Coalition: PP / PTB / DEM / PSDB / PSB
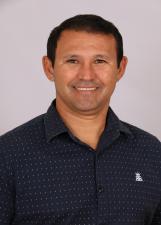
207Denilson Caleran3,7130.07%
Alternate · PDT · No. 12999
Coalition: PDT / SOLIDARIEDADE / PC do B

208Karl Dietz3,6500.07%
Alternate · PR · No. 22333
Coalition: PRB / PHS / PR / AVANTE
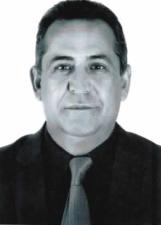
209Bill Pasteis3,5960.07%
Alternate · PSL · No. 17011
Coalition: PSL / PTC / PATRIOTA
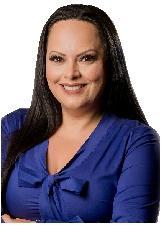
210Silvana Candido3,5030.07%
Alternate · PP · No. 11456
Coalition: PP / PTB / DEM / PSDB / PSB
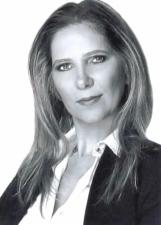
211Doutora Malu Viel3,3920.06%
Alternate · PSL · No. 17122
Coalition: PSL / PTC / PATRIOTA
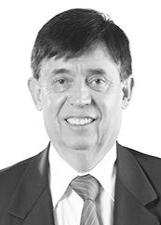
212Dr Nelso Rodrigues3,3070.06%
Alternate · PPS · No. 23222
213Gilson Marcondes3,2970.06%
Alternate · PV · No. 43277

214Professora Daniele3,2900.06%
Alternate · SOLIDARIEDADE · No. 77777
Coalition: PDT / SOLIDARIEDADE / PC do B
215Katia dos Animais de Rua3,2830.06%
Alternate · SOLIDARIEDADE · No. 77770
Coalition: PDT / SOLIDARIEDADE / PC do B
216Renaldo Rodrigues3,2770.06%
Alternate · PRB · No. 10456
Coalition: PRB / PHS / PR / AVANTE
217Ana Mira3,2600.06%
PSOL · No. 50111
Coalition: PSOL / PCB

218Osni Menezes3,1780.06%
Alternate · PV · No. 43444
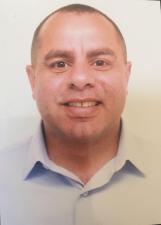
219Ricardo Kusch3,1370.06%
Alternate · PSD · No. 55153
Coalition: PSC / PSD

220Erasto Taxista3,0770.06%
Alternate · PROS · No. 90333
Coalition: PROS / PMB / PMN
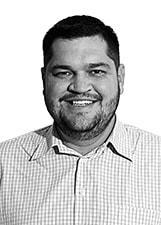
221Tiago Ranieri3,0200.06%
Alternate · AVANTE · No. 70222
Coalition: PRB / PHS / PR / AVANTE
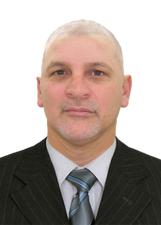
222Cesar Nortão3,0080.06%
Alternate · PODE · No. 19777
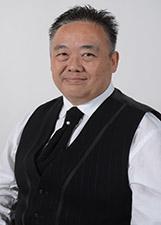
223Pastor Silvio Toshio2,9850.06%
Alternate · PRTB · No. 28333
Coalition: PRTB / PRP

224Discioli2,9830.06%
Alternate · PSL · No. 17555
Coalition: PSL / PTC / PATRIOTA
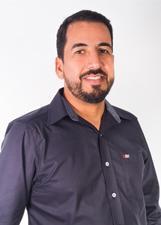
225Fabão Potência2,8890.05%
Alternate · PMN · No. 33234
Coalition: PROS / PMB / PMN

226Marisa Gazzola2,8830.05%
Alternate · PSL · No. 17740
Coalition: PSL / PTC / PATRIOTA
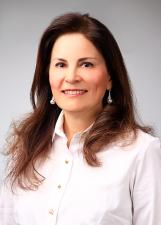
227Dra Katita2,8490.05%
Alternate · PODE · No. 19019
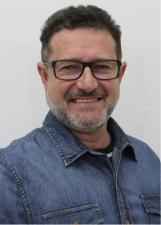
228Sandro Adao2,8400.05%
Alternate · PDT · No. 12240
Coalition: PDT / SOLIDARIEDADE / PC do B
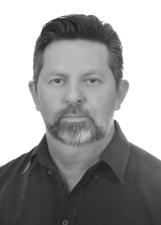
229Professor Marcos Kloster2,8240.05%
Alternate · MDB · No. 15123
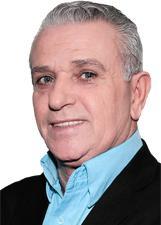
230Adelsom Batista2,8130.05%
Alternate · PMN · No. 33123
Coalition: PROS / PMB / PMN
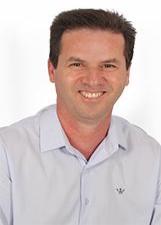
231Edilson Gabriel2,7950.05%
Alternate · PT · No. 13100

232Juliano Kunen2,7820.05%
Alternate · PODE · No. 19191
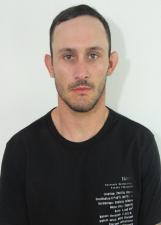
233Itamar Camargo2,7360.05%
Alternate · PSL · No. 17177
Coalition: PSL / PTC / PATRIOTA

234Carlinhos da Sinaleira2,7090.05%
Alternate · PRB · No. 10147
Coalition: PRB / PHS / PR / AVANTE
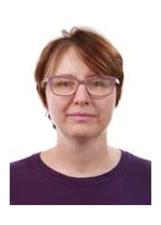
235Professora Josiane Kieras2,7050.05%
PSOL · No. 50650
Coalition: PSOL / PCB
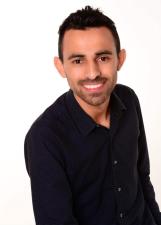
236Juninho Pemac2,6920.05%
Alternate · PV · No. 43002
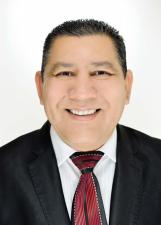
237João Vilmar2,6730.05%
Alternate · PP · No. 11211
Coalition: PP / PTB / DEM / PSDB / PSB

238Gary Smith2,6470.05%
Alternate · PSL · No. 17500
Coalition: PSL / PTC / PATRIOTA
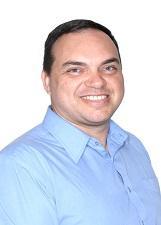
239Sargento Fontana2,6470.05%
Alternate · PMN · No. 33190
Coalition: PROS / PMB / PMN
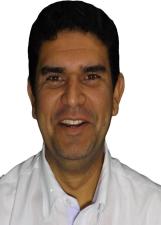
240Rogerio Credence2,5050.05%
Alternate · PSL · No. 17277
Coalition: PSL / PTC / PATRIOTA
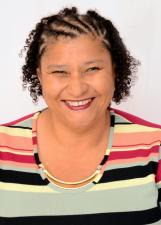
241Ivone do PT2,4950.05%
Alternate · PT · No. 13567
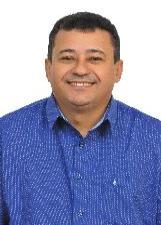
242Pedrinho da Mata2,4820.05%
Alternate · PP · No. 11444
Coalition: PP / PTB / DEM / PSDB / PSB

243Clodoaldo Camargo2,4430.05%
Alternate · PRP · No. 44200
Coalition: PRTB / PRP
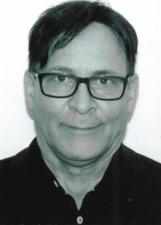
244Professor Celio Pinto Oliveira2,4390.05%
Alternate · PSL · No. 17800
Coalition: PSL / PTC / PATRIOTA
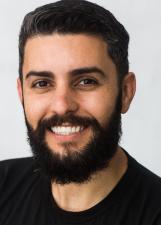
245Robson Padilha2,3880.05%
Alternate · PT · No. 13122
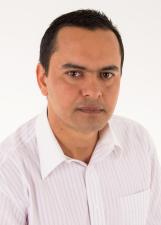
246Leandro Oliveira2,3510.04%
Alternate · PSB · No. 40022
Coalition: PP / PTB / DEM / PSDB / PSB
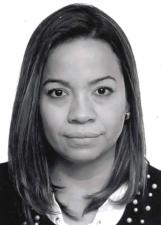
247Alexsandra Barroso2,3300.04%
Alternate · PSL · No. 17887
Coalition: PSL / PTC / PATRIOTA
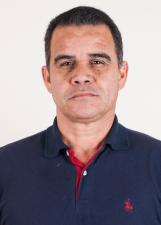
248Ricardo Marinho2,2750.04%
Alternate · PT · No. 13313
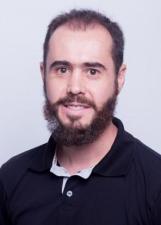
249Thiago Bagatin2,2430.04%
PSOL · No. 50500
Coalition: PSOL / PCB
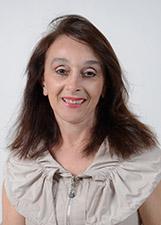
250Luci Boaretto2,2410.04%
Alternate · PRTB · No. 28220
Coalition: PRTB / PRP
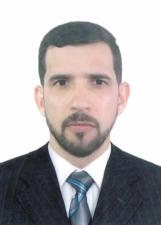
251Pastor Alessio Violato2,2300.04%
Alternate · PSL · No. 17789
Coalition: PSL / PTC / PATRIOTA

252Diogo Rech do Mandato Coletivo2,2030.04%
PSOL · No. 50420
Coalition: PSOL / PCB
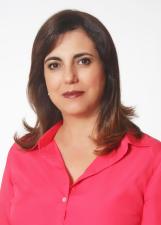
253Maria Regina Canonico2,1900.04%
Alternate · PODE · No. 19033
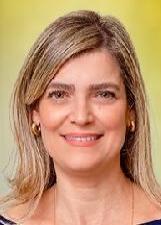
254Adriana Aguilera2,1800.04%
Alternate · PP · No. 11012
Coalition: PP / PTB / DEM / PSDB / PSB
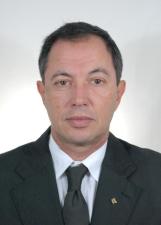
255Relly Agari Algodoal2,1770.04%
Alternate · PATRI · No. 51000

256Jeferson Fusaro2,1700.04%
Alternate · PRB · No. 10000
Coalition: PRB / PHS / PR / AVANTE
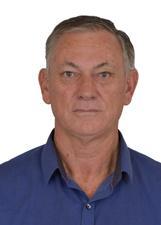
257Adauto Ibaiti2,1260.04%
Alternate · PMN · No. 33033
Coalition: PROS / PMB / PMN
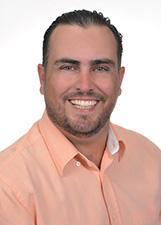
258Andre Guizilini2,1130.04%
Alternate · PDT · No. 12123
Coalition: PDT / SOLIDARIEDADE / PC do B
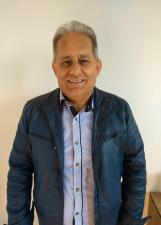
259Ari Valdir Lopes2,0840.04%
Alternate · PV · No. 43044
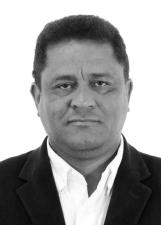
260Tikin Teixeira2,0800.04%
Alternate · PTC · No. 36181
Coalition: PSL / PTC / PATRIOTA
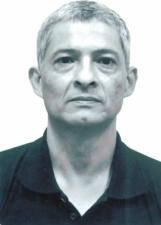
261Alexandre Saito2,0700.04%
Alternate · PSL · No. 17333
Coalition: PSL / PTC / PATRIOTA
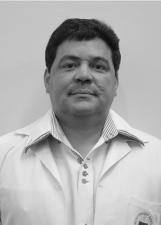
262Santander2,0690.04%
Alternate · PTC · No. 36000
Coalition: PSL / PTC / PATRIOTA
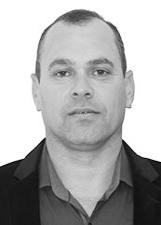
263Sargento Kaiser2,0600.04%
Alternate · PPS · No. 23193

264Isabel Baran2,0410.04%
Alternate · REDE · No. 18500
Coalition: REDE / DC / PPL
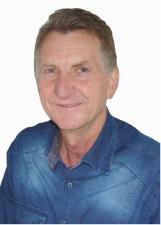
265Gentil Paske1,9980.04%
Alternate · PV · No. 43243
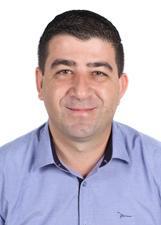
266Marcelo Rodrigues1,9790.04%
Alternate · PP · No. 11999
Coalition: PP / PTB / DEM / PSDB / PSB
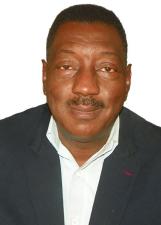
267Jorge Antonio do Nascimento1,9740.04%
Alternate · PSB · No. 40501
Coalition: PP / PTB / DEM / PSDB / PSB
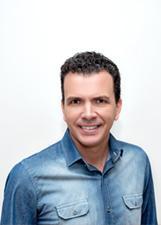
268Gabriel Pasa1,9280.04%
Alternate · PMN · No. 33125
Coalition: PROS / PMB / PMN

269Sigley Narcizo1,9130.04%
Alternate · PMB · No. 35035
Coalition: PROS / PMB / PMN
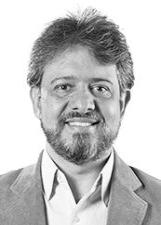
270Fabiano Vicente Elias1,8580.04%
Alternate · PPS · No. 23400
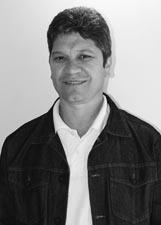
271Mario Mezaque1,8560.04%
Alternate · PRP · No. 44014
Coalition: PRTB / PRP

272Professor Cunha Filho1,8530.04%
Alternate · PSL · No. 17150
Coalition: PSL / PTC / PATRIOTA
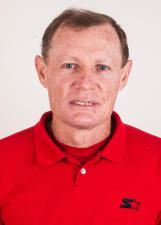
273Maurão1,8430.04%
Alternate · PT · No. 13007
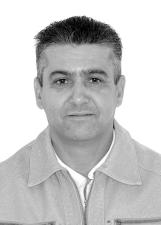
274Dirceu Três Lagoas1,8230.03%
Alternate · DC · No. 27000
Coalition: REDE / DC / PPL
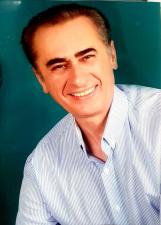
275Alcides da Acomac1,8020.03%
Alternate · PV · No. 43051
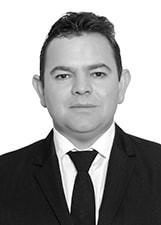
276Dely Seret1,7960.03%
Alternate · AVANTE · No. 70123
Coalition: PRB / PHS / PR / AVANTE

277Professor Marlus Forigo1,7850.03%
Alternate · REDE · No. 18111
Coalition: REDE / DC / PPL
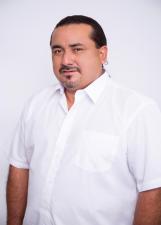
278Ivan Kaingang1,7660.03%
Alternate · PHS · No. 31234
Coalition: PRB / PHS / PR / AVANTE
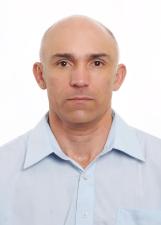
279Nelson Policial1,7620.03%
Alternate · MDB · No. 15000

280Jeiel dos Bombons1,7530.03%
Alternate · PRB · No. 10111
Coalition: PRB / PHS / PR / AVANTE
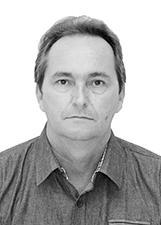
281Vital1,7500.03%
Alternate · PRP · No. 44444
Coalition: PRTB / PRP
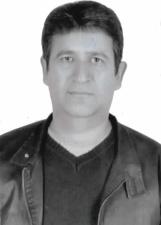
282Investigador Pinheiro1,7110.03%
Alternate · PSL · No. 17888
Coalition: PSL / PTC / PATRIOTA
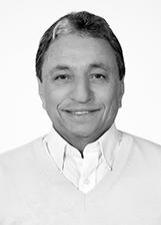
283Tucano1,7080.03%
Alternate · PPL · No. 54000
Coalition: REDE / DC / PPL

284Professor Luiz Arnaldo1,6750.03%
Alternate · PR · No. 22777
Coalition: PRB / PHS / PR / AVANTE
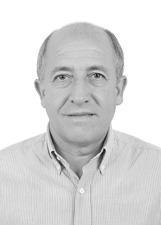
285Cide1,6670.03%
Alternate · PTB · No. 14444
Coalition: PP / PTB / DEM / PSDB / PSB
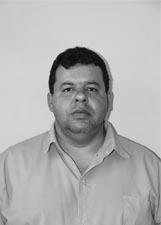
286Tio Gerson1,6580.03%
Alternate · PRP · No. 44400
Coalition: PRTB / PRP
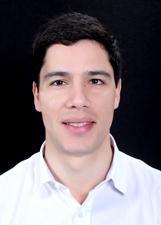
287Gabriel Antunes1,6460.03%
Alternate · PMN · No. 33500
Coalition: PROS / PMB / PMN

288Jéssica Magno1,6460.03%
Alternate · PT · No. 13613

289Eduardo von Der Osten1,6430.03%
Alternate · PV · No. 43456
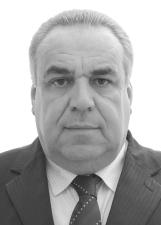
290Bolota1,6380.03%
Alternate · PR · No. 22345
Coalition: PRB / PHS / PR / AVANTE
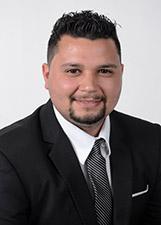
291Jean Martins1,6330.03%
Alternate · PRTB · No. 28777
Coalition: PRTB / PRP

292Valdecir Santos1,6260.03%
Alternate · PROS · No. 90133
Coalition: PROS / PMB / PMN

293Roni Surek1,6210.03%
Alternate · PROS · No. 90123
Coalition: PROS / PMB / PMN
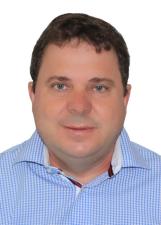
294Dr. Esposti1,6060.03%
Alternate · PP · No. 11014
Coalition: PP / PTB / DEM / PSDB / PSB
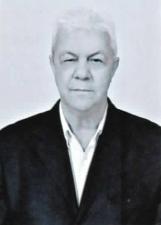
295Almir Pereira1,6030.03%
Alternate · PSL · No. 17034
Coalition: PSL / PTC / PATRIOTA
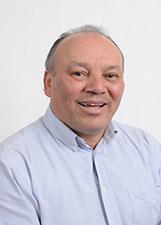
296Adalmo Alves1,5850.03%
Alternate · PRTB · No. 28000
Coalition: PRTB / PRP
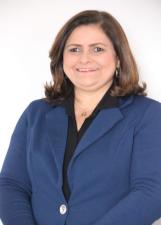
297Maria Andreia (professora)1,5770.03%
Alternate · PP · No. 11234
Coalition: PP / PTB / DEM / PSDB / PSB
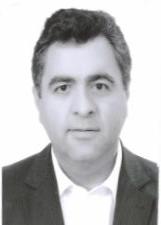
298Heico Silva1,5730.03%
Alternate · PPS · No. 23555
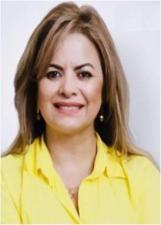
299Roselia Furman1,5670.03%
Alternate · PSD · No. 55369
Coalition: PSC / PSD
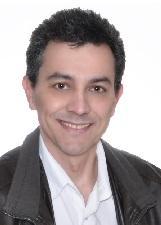
300Cesar Rozek1,5610.03%
Alternate · PMN · No. 33222
Coalition: PROS / PMB / PMN

301Rafael Leite1,5570.03%
Alternate · PV · No. 43500
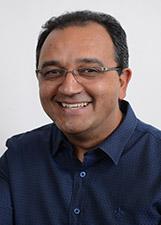
302André Freitas1,5010.03%
Alternate · PRTB · No. 28999
Coalition: PRTB / PRP

303Eliana Fuzari1,5010.03%
Alternate · PSD · No. 55788
Coalition: PSC / PSD
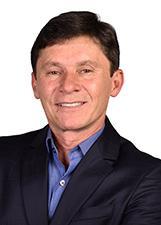
304Pedro Paulo1,5010.03%
Alternate · PDT · No. 12111
Coalition: PDT / SOLIDARIEDADE / PC do B
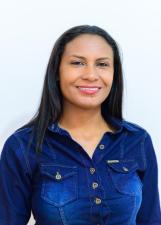
305Professora Josi Cruz1,4940.03%
Alternate · PT · No. 13456
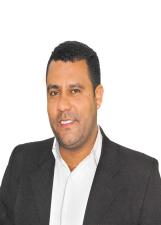
306Oliveira Junior1,4900.03%
Alternate · PRTB · No. 28100
Coalition: PRTB / PRP
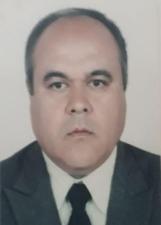
307Claudinho1,4860.03%
Alternate · PV · No. 43999
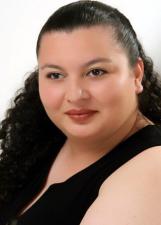
308Dalva Araujo Gonçalves1,4820.03%
Alternate · PDT · No. 12120
Coalition: PDT / SOLIDARIEDADE / PC do B
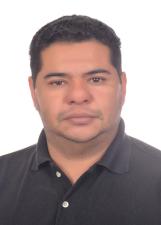
309Jm1,4770.03%
Alternate · PTB · No. 14875
Coalition: PP / PTB / DEM / PSDB / PSB
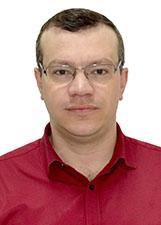
310Sidney da Kairos1,4520.03%
Alternate · PSB · No. 40000
Coalition: PP / PTB / DEM / PSDB / PSB
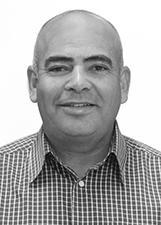
311Sargento Oliveira1,4510.03%
Alternate · PRP · No. 44190
Coalition: PRTB / PRP
312Basilio1,4470.03%
Alternate · PP · No. 11611
Coalition: PP / PTB / DEM / PSDB / PSB
313Jussara Cardoso1,4250.03%
Alternate · PDT · No. 12100
Coalition: PDT / SOLIDARIEDADE / PC do B

314Cláudia Mallmann1,4130.03%
PSOL · No. 50505
Coalition: PSOL / PCB
315Ademir Zacarias1,4080.03%
Alternate · PSC · No. 20220
Coalition: PSC / PSD
316Jô Baka1,4070.03%
Alternate · PDT · No. 12321
Coalition: PDT / SOLIDARIEDADE / PC do B

317Cesar Tavares1,3920.03%
Alternate · PV · No. 43888

318Nelmo Cassiano1,3630.03%
Alternate · REDE · No. 18018
Coalition: REDE / DC / PPL

319Andrezza Cordeiro1,3560.03%
Alternate · PSL · No. 17477
Coalition: PSL / PTC / PATRIOTA
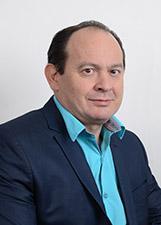
320Vanderlei Kibife1,2940.02%
Alternate · PRTB · No. 28028
Coalition: PRTB / PRP
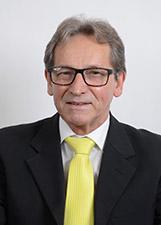
321Pedro Scherer1,2610.02%
Alternate · PRTB · No. 28800
Coalition: PRTB / PRP

322Marcos Dias1,2600.02%
Alternate · PSL · No. 17456
Coalition: PSL / PTC / PATRIOTA
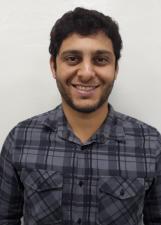
323Fabio Amorim1,2560.02%
Alternate · PT · No. 13777
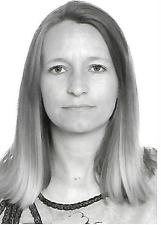
324Gislaine Indejejczak1,2370.02%
PSOL · No. 50180
Coalition: PSOL / PCB
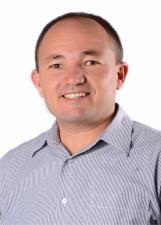
325Jussier1,2280.02%
Alternate · PP · No. 11311
Coalition: PP / PTB / DEM / PSDB / PSB
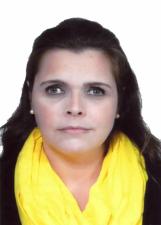
326Marcella Kretsch1,2190.02%
Alternate · PSL · No. 17221
Coalition: PSL / PTC / PATRIOTA

327Marco Zilio1,1940.02%
Alternate · SOLIDARIEDADE · No. 77000
Coalition: PDT / SOLIDARIEDADE / PC do B
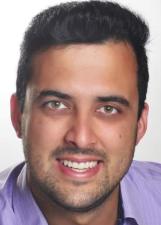
328Ricardo Trindade1,1930.02%
Alternate · PATRI · No. 51120

329Prof. Evaldo Bertoldi1,1910.02%
PSOL · No. 50100
Coalition: PSOL / PCB
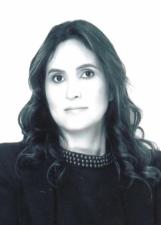
330Jozelia Raupp1,1900.02%
Alternate · PSL · No. 17170
Coalition: PSL / PTC / PATRIOTA
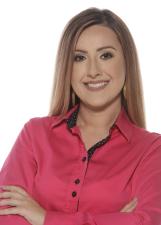
331Tonia Carla1,1690.02%
Alternate · PT · No. 13010

332Lourival Guimarães1,1630.02%
Alternate · PRB · No. 10555
Coalition: PRB / PHS / PR / AVANTE
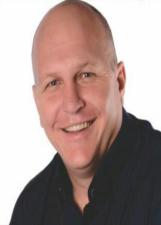
333Julio Fabri1,1570.02%
Alternate · PV · No. 43343
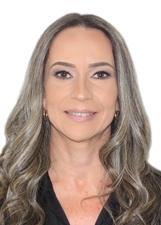
334Ana Fábia1,1560.02%
Alternate · PSD · No. 55543
Coalition: PSC / PSD
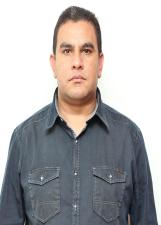
335Leal1,1550.02%
Alternate · PT · No. 13132
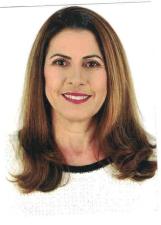
336Professora Silvana1,1340.02%
PSOL · No. 50150
Coalition: PSOL / PCB
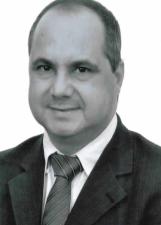
337ED Claudio Cruz - Claudinho1,1150.02%
Alternate · PSL · No. 17121
Coalition: PSL / PTC / PATRIOTA

338Irmão Barini1,0850.02%
Alternate · PSC · No. 20250
Coalition: PSC / PSD

339Jhonatan Vieira1,0840.02%
PSOL · No. 50000
Coalition: PSOL / PCB
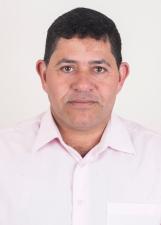
340Antonio Gato Preto1,0820.02%
Alternate · PT · No. 13101
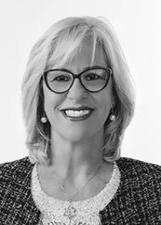
341Claudéte Olíveira1,0740.02%
Alternate · PPS · No. 23033
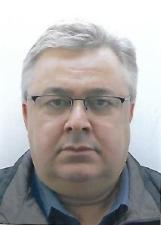
342Ze Luiz1,0590.02%
Alternate · PSD · No. 55236
Coalition: PSC / PSD
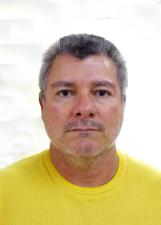
343Miltinho Contador1,0550.02%
Alternate · PTC · No. 36789
Coalition: PSL / PTC / PATRIOTA
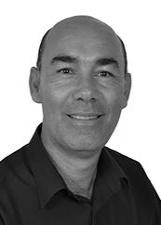
344Tabajara do Site1,0520.02%
Alternate · PPS · No. 23530
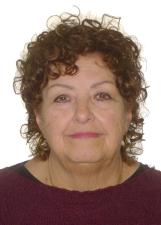
345Yara Damico1,0490.02%
Alternate · MDB · No. 15915
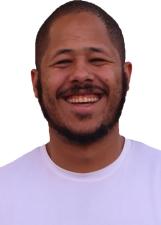
346Luis Lelis1,0390.02%
Alternate · PPS · No. 23777
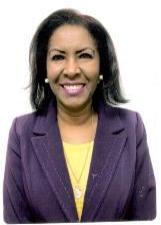
347Jandira1,0340.02%
Alternate · PSDB · No. 45450
Coalition: PP / PTB / DEM / PSDB / PSB
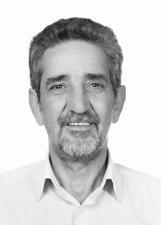
348Rivadal1,0320.02%
Alternate · PT · No. 13444
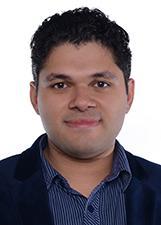
349Leonardo Salgado1,0230.02%
Alternate · PDT · No. 12222
Coalition: PDT / SOLIDARIEDADE / PC do B

350Oziel Rodrigues1,0200.02%
Alternate · PPS · No. 23007
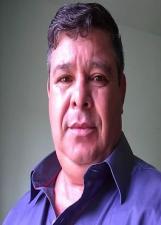
351Jose Cunha Uopeccan1,0060.02%
Alternate · MDB · No. 15555

352Professor Bruno9900.02%
Alternate · REDE · No. 18123
Coalition: REDE / DC / PPL

353Edemir da Saúde9810.02%
Alternate · PROS · No. 90900
Coalition: PROS / PMB / PMN
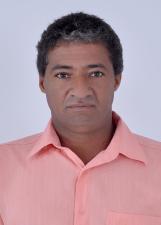
354Dema9790.02%
Alternate · PRB · No. 10200
Coalition: PRB / PHS / PR / AVANTE
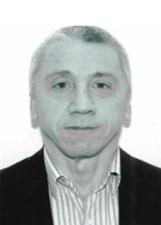
355Rabelo9760.02%
Alternate · PSL · No. 17377
Coalition: PSL / PTC / PATRIOTA
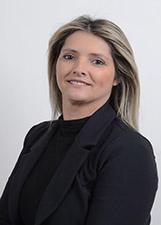
356Sonia Estefani9710.02%
Alternate · PRTB · No. 28222
Coalition: PRTB / PRP

357Pricila Souza9640.02%
Alternate · PSD · No. 55699
Coalition: PSC / PSD
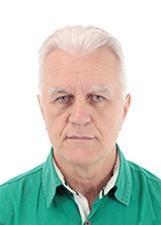
358Jorge Wisniewski Caminhoneiro9520.02%
Alternate · PV · No. 43151
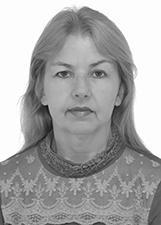
359Professora Sonia Brush9400.02%
Alternate · PROS · No. 90199
Coalition: PROS / PMB / PMN
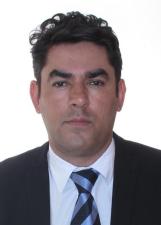
360Damasceno Junior9370.02%
Alternate · DC · No. 27027
Coalition: REDE / DC / PPL
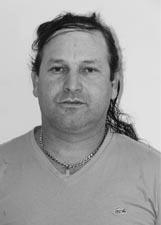
361Caetano da Radio9340.02%
Alternate · PRP · No. 44888
Coalition: PRTB / PRP
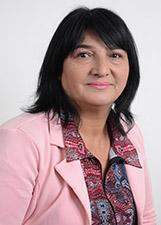
362Rosana Cristina Anastacio9320.02%
Alternate · PRTB · No. 28789
Coalition: PRTB / PRP

363Eduardo Caldeira9230.02%
Alternate · PROS · No. 90010
Coalition: PROS / PMB / PMN
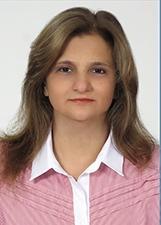
364Maria Izabel9110.02%
Alternate · DEM · No. 25025
Coalition: PP / PTB / DEM / PSDB / PSB

365Dra Marcilene Soares9070.02%
Alternate · PRB · No. 10055
Coalition: PRB / PHS / PR / AVANTE

366Gabriel Monteiro8980.02%
Alternate · PRP · No. 44044
Coalition: PRTB / PRP

367Professor Gledson Lopes8970.02%
Alternate · REDE · No. 18100
Coalition: REDE / DC / PPL
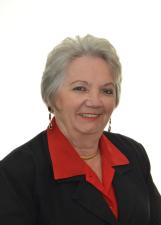
368Professora Zenilda8840.02%
Alternate · MDB · No. 15701
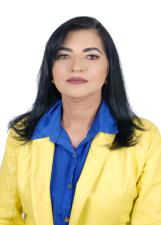
369Enir Becker8830.02%
Alternate · PRB · No. 10999
Coalition: PRB / PHS / PR / AVANTE

370Moacir Kornievicz da Silva8770.02%
Alternate · PODE · No. 19011
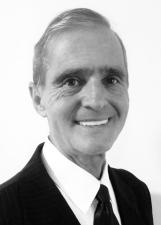
371Nelson Zanetti8770.02%
Alternate · PATRI · No. 51345
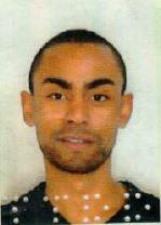
372Adriano Nascimento8740.02%
Alternate · PV · No. 43420

373Romuel Satin8710.02%
Alternate · PROS · No. 90800
Coalition: PROS / PMB / PMN
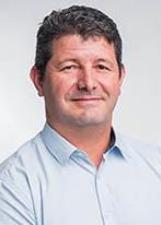
374José Edilson Borges8660.02%
Alternate · PROS · No. 90310
Coalition: PROS / PMB / PMN
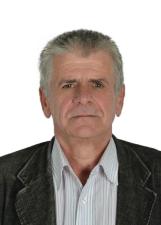
375Zico8570.02%
Alternate · PT · No. 13333

376Milton Oro8520.02%
Alternate · PRP · No. 44049
Coalition: PRTB / PRP

377Adilson Lipski - Peixe8490.02%
Alternate · PV · No. 43433
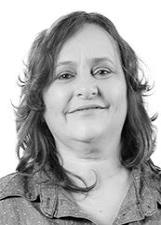
378Lurdinha do Povo8410.02%
Alternate · PPS · No. 23345
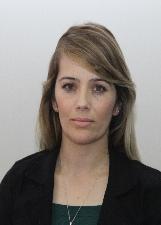
379Joicinha8380.02%
Alternate · PP · No. 11083
Coalition: PP / PTB / DEM / PSDB / PSB

380Tiago Serenato8370.02%
Alternate · PODE · No. 19100
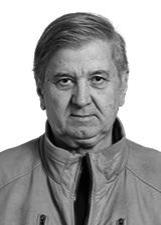
381Cel/prof. Mattos8350.02%
Alternate · PODE · No. 19249
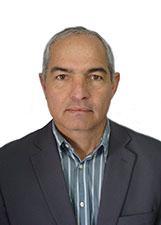
382Gerson Luis8330.02%
Alternate · PSC · No. 20011
Coalition: PSC / PSD
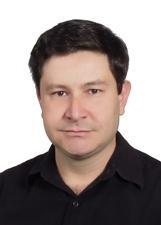
383Simeoni8330.02%
Alternate · PDT · No. 12001
Coalition: PDT / SOLIDARIEDADE / PC do B
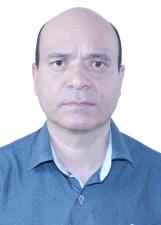
384Professor Juciel8170.02%
Alternate · MDB · No. 15515

385Gean Buss8130.02%
Alternate · PPS · No. 23300
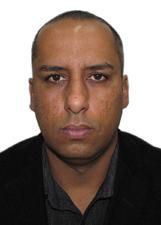
386Soldado Brasil8110.02%
Alternate · PMN · No. 33021
Coalition: PROS / PMB / PMN
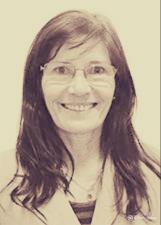
387Liliam Gusso8050.02%
Alternate · REDE · No. 18017
Coalition: REDE / DC / PPL
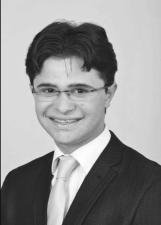
388Isaak Almeida8010.02%
Alternate · PTC · No. 36123
Coalition: PSL / PTC / PATRIOTA

389Rose Protetora dos Animais7930.02%
Alternate · PMB · No. 35222
Coalition: PROS / PMB / PMN
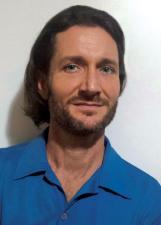
390Prof. Jeff7870.01%
PSOL · No. 50777
Coalition: PSOL / PCB
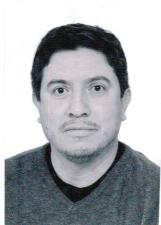
391Gilberto Gomes7870.01%
Alternate · PATRI · No. 51124
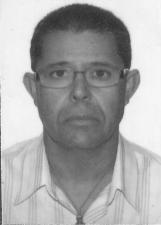
392Zé do Gás7810.01%
Alternate · PRP · No. 44611
Coalition: PRTB / PRP
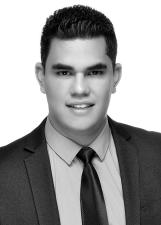
393Leandro Soares Machado7800.01%
Alternate · PPL · No. 54200
Coalition: REDE / DC / PPL

394Danielle Martins7640.01%
Alternate · PRB · No. 10700
Coalition: PRB / PHS / PR / AVANTE
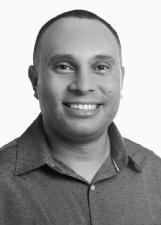
395Elias da Enfermagem7620.01%
Alternate · PPL · No. 54400
Coalition: REDE / DC / PPL
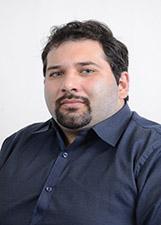
396Kassem Okdi7420.01%
Alternate · PRTB · No. 28123
Coalition: PRTB / PRP

397Adriano da Silva7260.01%
Alternate · DEM · No. 25123
Coalition: PP / PTB / DEM / PSDB / PSB
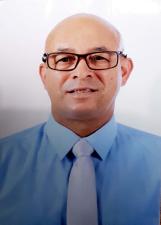
398Adão Trindade7250.01%
Alternate · PV · No. 43125
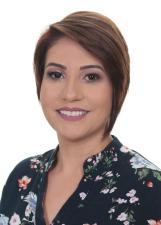
399Podóloga Rozelia Pretko7240.01%
Alternate · REDE · No. 18181
Coalition: REDE / DC / PPL
400Monica Melo7220.01%
Alternate · PSL · No. 17257
Coalition: PSL / PTC / PATRIOTA
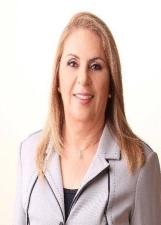
401Lucia Stoco7200.01%
Alternate · PSD · No. 55673
Coalition: PSC / PSD
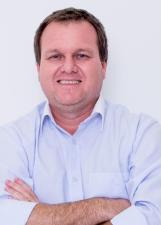
402Mario de Sa7090.01%
Alternate · PROS · No. 90540
Coalition: PROS / PMB / PMN

403Dr José Antonio7060.01%
Alternate · MDB · No. 15444

404Sandro Kuczera7010.01%
Alternate · PSC · No. 20040
Coalition: PSC / PSD
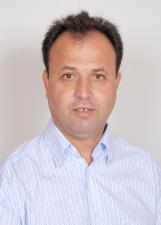
405Delei do Dico7000.01%
Alternate · PROS · No. 90110
Coalition: PROS / PMB / PMN
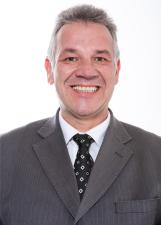
406Dr. Petroski7000.01%
Alternate · PODE · No. 19456
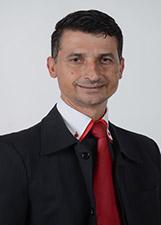
407Edmilson Forte6990.01%
Alternate · PRTB · No. 28888
Coalition: PRTB / PRP
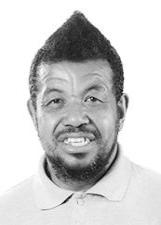
408Maninho das Frutas6980.01%
Alternate · PPS · No. 23833
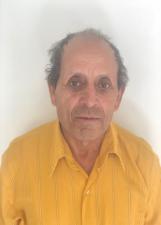
409Ze Aparecido6930.01%
Alternate · MDB · No. 15680

410Gabriel Bonaym6920.01%
Alternate · PPL · No. 54080
Coalition: REDE / DC / PPL

411Angela Louise Vigano6910.01%
Alternate · PV · No. 43025
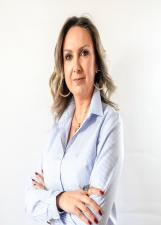
412Jô Cunha6910.01%
Alternate · MDB · No. 15613
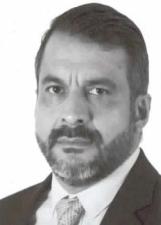
413Elenilson Michikovski6880.01%
Alternate · PSL · No. 17117
Coalition: PSL / PTC / PATRIOTA

414Comandante Ferreira6870.01%
Alternate · PSC · No. 20190
Coalition: PSC / PSD
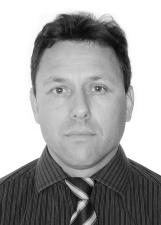
415Rodrigo Bombeiro6850.01%
Alternate · PRP · No. 44193
Coalition: PRTB / PRP
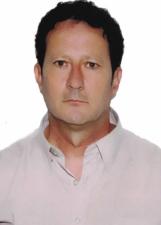
416Sandro Kalil6830.01%
Alternate · PSL · No. 17700
Coalition: PSL / PTC / PATRIOTA
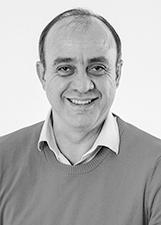
417Professor Carlos6810.01%
Alternate · PT · No. 13713

418Rafael Renner6720.01%
Alternate · PRTB · No. 28910
Coalition: PRTB / PRP
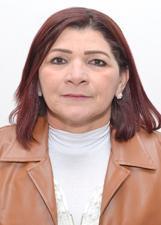
419Perpetua Socorro da Cruz Souza6700.01%
Alternate · PSC · No. 20510
Coalition: PSC / PSD
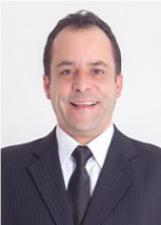
420Godinho6600.01%
Alternate · PV · No. 43021
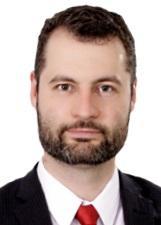
421Marcel6580.01%
Alternate · PODE · No. 19001

422Abiézer Camargo6570.01%
PSOL · No. 50456
Coalition: PSOL / PCB
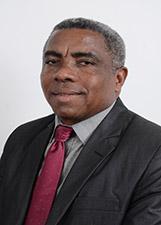
423Pastor João dos Anjos6570.01%
Alternate · PRTB · No. 28880
Coalition: PRTB / PRP
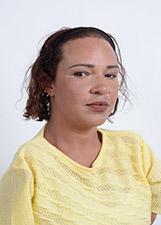
424Jeniffer6520.01%
Alternate · PRTB · No. 28077
Coalition: PRTB / PRP
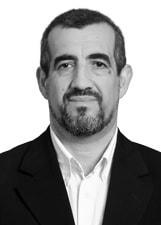
425Alvaro (bile)6480.01%
Alternate · AVANTE · No. 70168
Coalition: PRB / PHS / PR / AVANTE
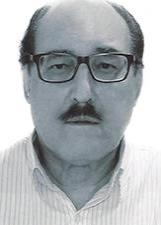
426Tinoco6460.01%
Alternate · PRP · No. 44512
Coalition: PRTB / PRP
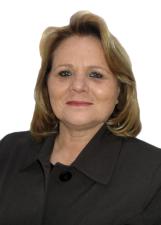
427Iara Vaz6450.01%
Alternate · PSD · No. 55190
Coalition: PSC / PSD

428Marcia Barausse6410.01%
Alternate · PSB · No. 40444
Coalition: PP / PTB / DEM / PSDB / PSB
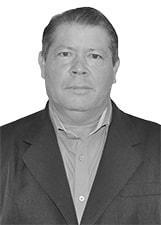
429Prof. Reinaldo6400.01%
Alternate · PSC · No. 20999
Coalition: PSC / PSD
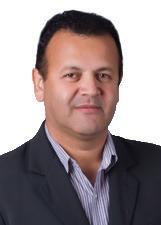
430Jair Pereira (sintespar)6340.01%
Alternate · PV · No. 43143
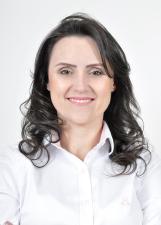
431Rosângela Silveira6320.01%
Alternate · PSC · No. 20050
Coalition: PSC / PSD

432Gisele Silva6300.01%
Alternate · PSD · No. 55233
Coalition: PSC / PSD

433Jorge Freitas6290.01%
Alternate · PPS · No. 23100
434Aguinaldo do Posto6290.01%
Alternate · REDE · No. 18000
Coalition: REDE / DC / PPL

435Edivan Mota6280.01%
Alternate · PRB · No. 10345
Coalition: PRB / PHS / PR / AVANTE

436Carina Daniel6280.01%
Alternate · PODE · No. 19199
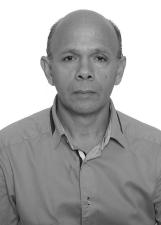
437Apostolo Gilmar Carvalho6190.01%
Alternate · PSL · No. 17155
Coalition: PSL / PTC / PATRIOTA
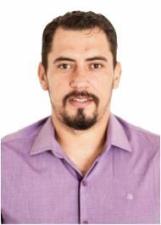
438Andre Luz6080.01%
Alternate · PHS · No. 31012
Coalition: PRB / PHS / PR / AVANTE
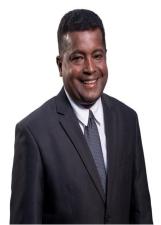
439Mestre Sidney6070.01%
Alternate · PRB · No. 10222
Coalition: PRB / PHS / PR / AVANTE
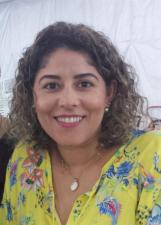
440Sayonara Neves6050.01%
Alternate · PV · No. 43200

441Emarielly Georgea Ramos6050.01%
Alternate · MDB · No. 15456

442Angela Gouveia5970.01%
Alternate · MDB · No. 15615

443Professor Marcão5960.01%
Alternate · PROS · No. 90013
Coalition: PROS / PMB / PMN

444Jefferson Moises5950.01%
Alternate · SOLIDARIEDADE · No. 77044
Coalition: PDT / SOLIDARIEDADE / PC do B
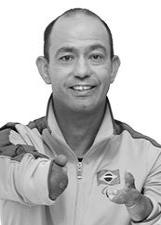
445Moises Batista5950.01%
Alternate · PPS · No. 23011
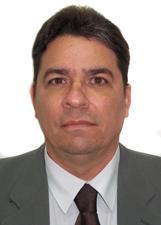
446Capitao Victor5830.01%
Alternate · PSC · No. 20002
Coalition: PSC / PSD
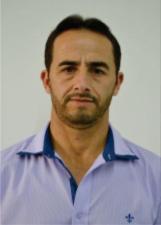
447Jesuel Lima5810.01%
Alternate · PV · No. 43003
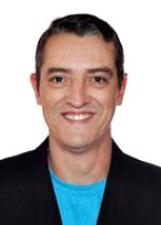
448Vanderlei Voiski5810.01%
Alternate · PODE · No. 19112

449Mexicano5800.01%
Alternate · PSB · No. 40440
Coalition: PP / PTB / DEM / PSDB / PSB

450Geraldo Rosso5730.01%
Alternate · PROS · No. 90197
Coalition: PROS / PMB / PMN
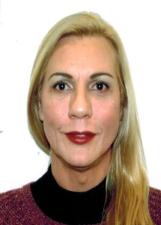
451Gisele Alessandra Shimidt5730.01%
Alternate · PSB · No. 40443
Coalition: PP / PTB / DEM / PSDB / PSB
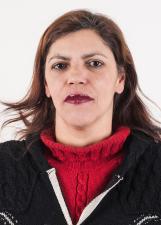
452Prof. Giane Lula Herllain5710.01%
Alternate · PT · No. 13321

453Wagner Vivian5690.01%
Alternate · PRTB · No. 28128
Coalition: PRTB / PRP

454Ana Belonci5660.01%
Alternate · PPS · No. 23888
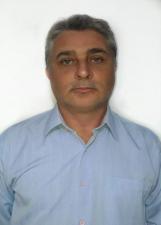
455Cristiano Serena5640.01%
Alternate · PSD · No. 55355
Coalition: PSC / PSD
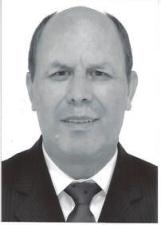
456Dorival Simões5620.01%
Alternate · PV · No. 43121
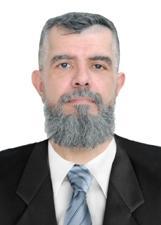
457Urso5590.01%
PSOL · No. 50250
Coalition: PSOL / PCB
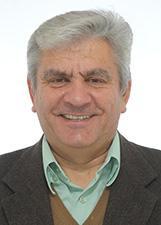
458Gerson Gusso5590.01%
Alternate · PMN · No. 33300
Coalition: PROS / PMB / PMN
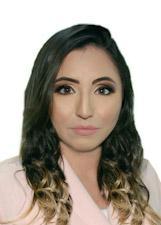
459Ellys Dayane5550.01%
Alternate · PSDB · No. 45005
Coalition: PP / PTB / DEM / PSDB / PSB
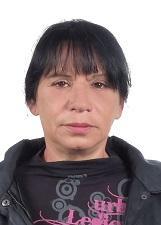
460Celina Prestes5430.01%
Alternate · MDB · No. 15111

461Luciana Capozze5420.01%
Alternate · PSD · No. 55455
Coalition: PSC / PSD
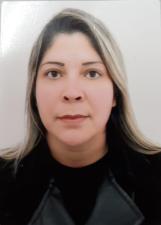
462Luzia Kapp5420.01%
Alternate · MDB · No. 15679

463Angela Donha5350.01%
Alternate · PPS · No. 23041
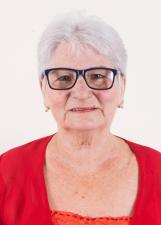
464Odila Raizel5280.01%
Alternate · PT · No. 13311
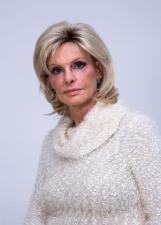
465Iza Zilli522<0.01%
Alternate · PODE · No. 19018
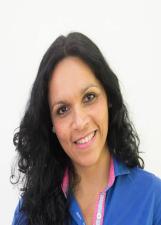
466Juliana Sydor521<0.01%
Alternate · REDE · No. 18888
Coalition: REDE / DC / PPL

467Anderson Ribeiro520<0.01%
Alternate · REDE · No. 18333
Coalition: REDE / DC / PPL

468Edison Fischer519<0.01%
Alternate · PSL · No. 17444
Coalition: PSL / PTC / PATRIOTA

469Wesley Tamagi516<0.01%
Alternate · PRB · No. 10246
Coalition: PRB / PHS / PR / AVANTE
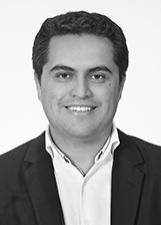
470Claudemir Santos515<0.01%
Alternate · PODE · No. 19367
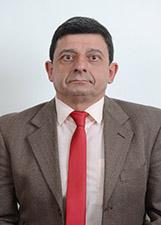
471Mister Bim507<0.01%
Alternate · PRTB · No. 28088
Coalition: PRTB / PRP
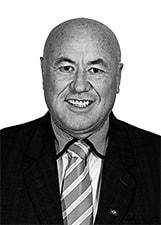
472Campelo502<0.01%
Alternate · AVANTE · No. 70070
Coalition: PRB / PHS / PR / AVANTE
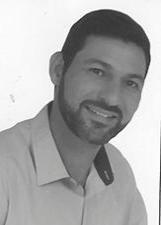
473Carlinho502<0.01%
Alternate · PRP · No. 44144
Coalition: PRTB / PRP

474Marcelo Tubarão497<0.01%
Alternate · PPL · No. 54544
Coalition: REDE / DC / PPL
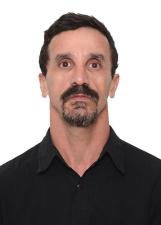
475Prof. Marcelo Lima491<0.01%
PSOL · No. 50123
Coalition: PSOL / PCB
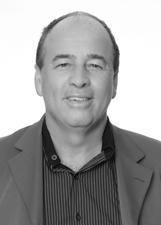
476Amilton Motorista490<0.01%
Alternate · PROS · No. 90191
Coalition: PROS / PMB / PMN
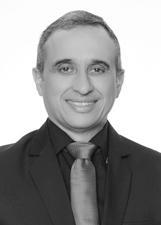
477Professor Edilson488<0.01%
Alternate · PROS · No. 90284
Coalition: PROS / PMB / PMN
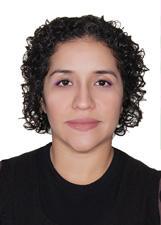
478Raquel Colaço487<0.01%
Alternate · PV · No. 43678
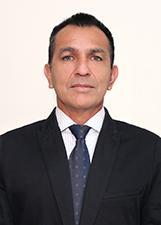
479Gm Adriano Dúdio478<0.01%
Alternate · DC · No. 27153
Coalition: REDE / DC / PPL

480Amanda Penga476<0.01%
Alternate · PV · No. 43111
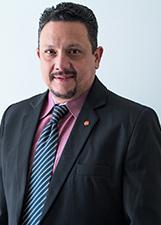
481Paulo Ivo Rodrigues Neto473<0.01%
Alternate · PODE · No. 19493
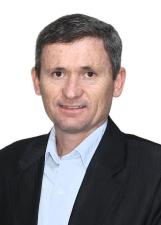
482Loro do PV472<0.01%
Alternate · PV · No. 43191
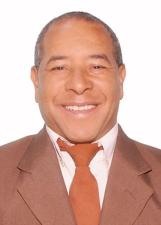
483Leu Silva472<0.01%
Alternate · PRB · No. 10333
Coalition: PRB / PHS / PR / AVANTE
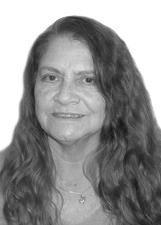
484Tita Gonçalves472<0.01%
Alternate · PP · No. 11155
Coalition: PP / PTB / DEM / PSDB / PSB

485Ester Marcante472<0.01%
Alternate · PSL · No. 17313
Coalition: PSL / PTC / PATRIOTA
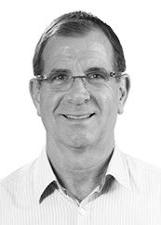
486Daniel Isfer453<0.01%
Alternate · PPS · No. 23230
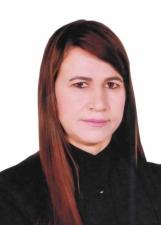
487Vanete Silva449<0.01%
Alternate · PSL · No. 17120
Coalition: PSL / PTC / PATRIOTA
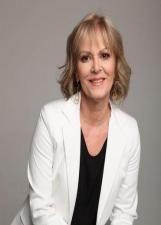
488Rosane Neumann447<0.01%
Alternate · PP · No. 11411
Coalition: PP / PTB / DEM / PSDB / PSB
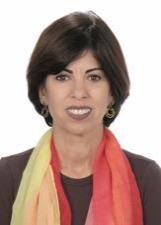
489Professora Angella446<0.01%
Alternate · PSB · No. 40965
Coalition: PP / PTB / DEM / PSDB / PSB
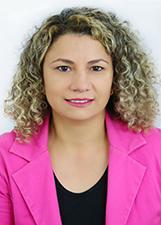
490Rozangela Trindade442<0.01%
Alternate · PMN · No. 33223
Coalition: PROS / PMB / PMN
491Eloir Almeida441<0.01%
Alternate · MDB · No. 15800
492Alcione Valentim435<0.01%
Alternate · PRTB · No. 28017
Coalition: PRTB / PRP
493Luiz Franco434<0.01%
Alternate · PDT · No. 12121
Coalition: PDT / SOLIDARIEDADE / PC do B
494Professora Vera432<0.01%
Alternate · PV · No. 43222
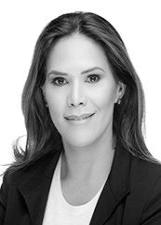
495Rosana Monney Ribas432<0.01%
Alternate · PPS · No. 23200
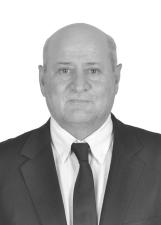
496Itacir429<0.01%
Alternate · PROS · No. 90077
Coalition: PROS / PMB / PMN

497Juarez Firmino429<0.01%
Alternate · PODE · No. 19023
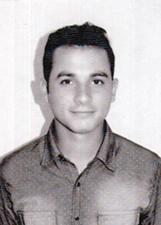
498Thiago Nunes422<0.01%
Alternate · PATRI · No. 51321

499Bianca Gabriele415<0.01%
Alternate · REDE · No. 18321
Coalition: REDE / DC / PPL
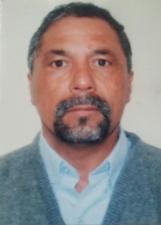
500Pedro Lazina411<0.01%
Alternate · PV · No. 43743
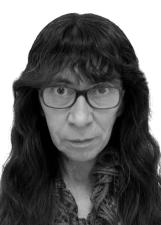
501Ana Maria de Carvalho409<0.01%
PSOL · No. 50789
Coalition: PSOL / PCB
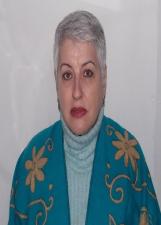
502Meire Maia Cleve407<0.01%
Alternate · PSDB · No. 45500
Coalition: PP / PTB / DEM / PSDB / PSB
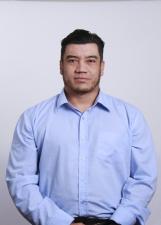
503Fabio Fantasma402<0.01%
Alternate · PV · No. 43258

504Professora Ligia401<0.01%
Alternate · PSDB · No. 45007
Coalition: PP / PTB / DEM / PSDB / PSB
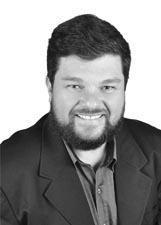
505Vava Locutor/fisioterapeuta397<0.01%
Alternate · PRP · No. 44952
Coalition: PRTB / PRP
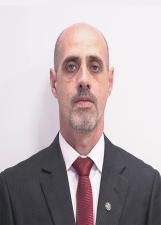
506Ulisses Candreva392<0.01%
Alternate · PRTB · No. 28328
Coalition: PRTB / PRP
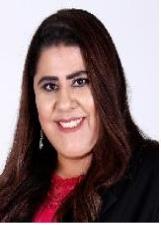
507Eliany Alves Feitoza389<0.01%
Alternate · PDT · No. 12400
Coalition: PDT / SOLIDARIEDADE / PC do B

508Marquinho Lima388<0.01%
Alternate · PRTB · No. 28200
Coalition: PRTB / PRP
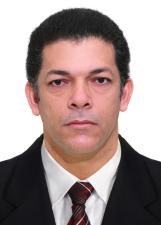
509Maurão Messias388<0.01%
Alternate · PODE · No. 19190

510Milico387<0.01%
Alternate · PROS · No. 90345
Coalition: PROS / PMB / PMN
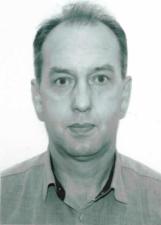
511Tiozinho do Dog384<0.01%
Alternate · PSL · No. 17020
Coalition: PSL / PTC / PATRIOTA

512Angela382<0.01%
Alternate · AVANTE · No. 70012
Coalition: PRB / PHS / PR / AVANTE
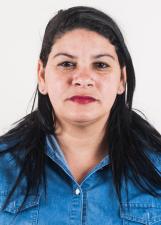
513Geny Lemes da Silva376<0.01%
Alternate · PT · No. 13654
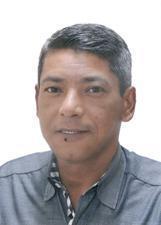
514Cazuza373<0.01%
Alternate · PSDB · No. 45190
Coalition: PP / PTB / DEM / PSDB / PSB
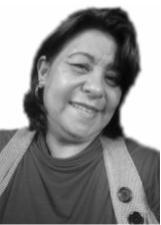
515Leo da Saude367<0.01%
Alternate · PROS · No. 90533
Coalition: PROS / PMB / PMN
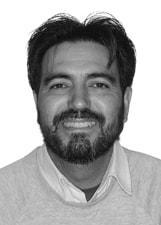
516Agnaldo366<0.01%
Alternate · AVANTE · No. 70080
Coalition: PRB / PHS / PR / AVANTE

517Leuzinha do Cavalo363<0.01%
Alternate · PRB · No. 10810
Coalition: PRB / PHS / PR / AVANTE
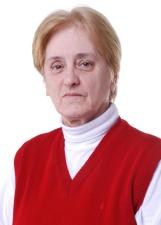
518Maria Alice Cordeiro357<0.01%
Alternate · PRB · No. 10500
Coalition: PRB / PHS / PR / AVANTE
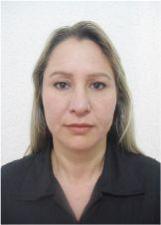
519Mari do Litoral357<0.01%
Alternate · PMN · No. 33555
Coalition: PROS / PMB / PMN
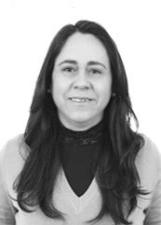
520Cleusa Camargo357<0.01%
Alternate · PPS · No. 23213

521Vandeli Lima356<0.01%
Alternate · PP · No. 11911
Coalition: PP / PTB / DEM / PSDB / PSB
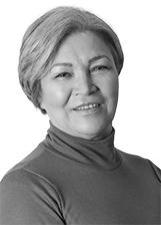
522Tania Alberti353<0.01%
Alternate · PRB · No. 10911
Coalition: PRB / PHS / PR / AVANTE

523Mibach353<0.01%
Alternate · PHS · No. 31777
Coalition: PRB / PHS / PR / AVANTE
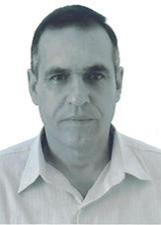
524Teixeira350<0.01%
Alternate · PRP · No. 44555
Coalition: PRTB / PRP
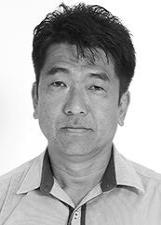
525Haroldo Kimura350<0.01%
Alternate · PPS · No. 23510
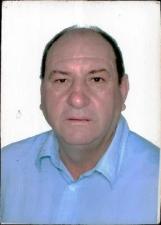
526Mauro Spina348<0.01%
Alternate · PDT · No. 12200
Coalition: PDT / SOLIDARIEDADE / PC do B

527Janayna347<0.01%
Alternate · DC · No. 27776
Coalition: REDE / DC / PPL
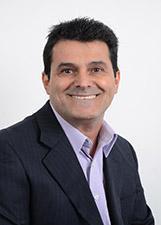
528Pedrinho Craveiro344<0.01%
Alternate · PRTB · No. 28003
Coalition: PRTB / PRP

529Carol Marinho342<0.01%
Alternate · REDE · No. 18777
Coalition: REDE / DC / PPL
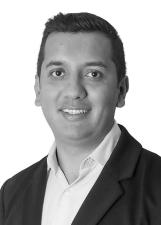
530Kiko Baptista341<0.01%
Alternate · PRB · No. 10808
Coalition: PRB / PHS / PR / AVANTE
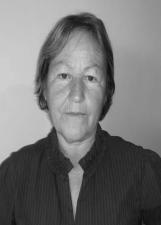
531Rosa Maria339<0.01%
Alternate · PRTB · No. 28006
Coalition: PRTB / PRP
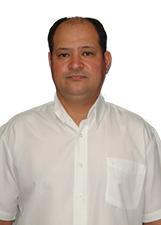
532Jaderson Jacaré333<0.01%
Alternate · PMN · No. 33456
Coalition: PROS / PMB / PMN

533Marcia da Avon331<0.01%
Alternate · PROS · No. 90001
Coalition: PROS / PMB / PMN
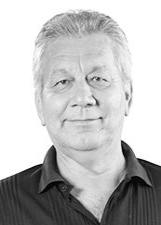
534Julio Mendes Nôka323<0.01%
Alternate · PPS · No. 23789
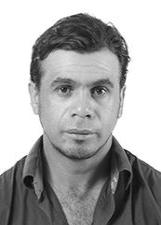
535Ademir Paçoca323<0.01%
Alternate · PPS · No. 23113
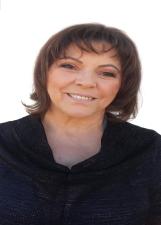
536Mara Martins322<0.01%
PSOL · No. 50222
Coalition: PSOL / PCB
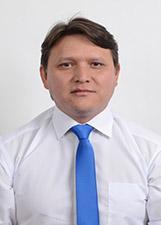
537Jesiel Siva322<0.01%
Alternate · PRTB · No. 28078
Coalition: PRTB / PRP
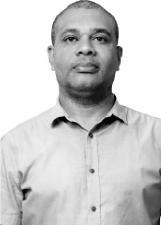
538Aldo Moraes319<0.01%
Alternate · PPL · No. 54233
Coalition: REDE / DC / PPL
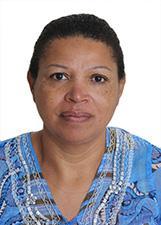
539Marisa Filha da Ica317<0.01%
Alternate · PSC · No. 20021
Coalition: PSC / PSD

540Daniel Covach317<0.01%
Alternate · PSC · No. 20022
Coalition: PSC / PSD
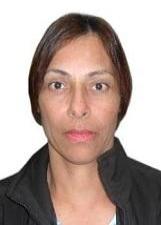
541Izabel Cristina Soares Lopes317<0.01%
Alternate · PDT · No. 12396
Coalition: PDT / SOLIDARIEDADE / PC do B
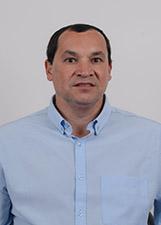
542Dilson Moreira315<0.01%
Alternate · PRTB · No. 28111
Coalition: PRTB / PRP
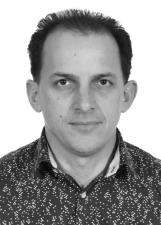
543José Santos315<0.01%
Alternate · PODE · No. 19600

544Marcia Alves Martins313<0.01%
Alternate · PP · No. 11112
Coalition: PP / PTB / DEM / PSDB / PSB
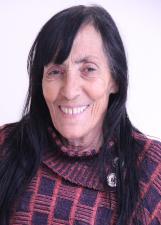
545Maria do Bairro313<0.01%
Alternate · PP · No. 11122
Coalition: PP / PTB / DEM / PSDB / PSB
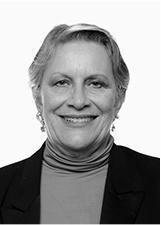
546Nilde308<0.01%
Alternate · PMB · No. 35444
Coalition: PROS / PMB / PMN
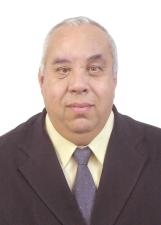
547Sanchez Wuinsor304<0.01%
Alternate · DEM · No. 25055
Coalition: PP / PTB / DEM / PSDB / PSB
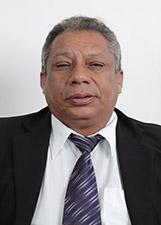
548Pastor Adão301<0.01%
Alternate · PRTB · No. 28004
Coalition: PRTB / PRP
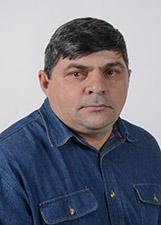
549Enio Grigoleto296<0.01%
Alternate · PRTB · No. 28133
Coalition: PRTB / PRP
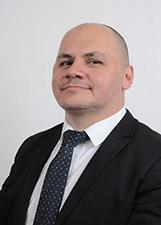
550Beto Bonassoli294<0.01%
Alternate · PRTB · No. 28007
Coalition: PRTB / PRP
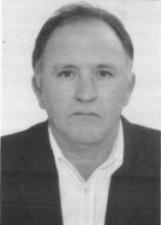
551Diadosk289<0.01%
Alternate · PPS · No. 23999

552José Ribas287<0.01%
Alternate · PSDB · No. 45555
Coalition: PP / PTB / DEM / PSDB / PSB
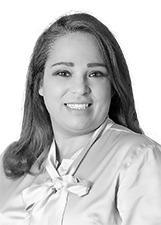
553Pastora Tatiane Galvão285<0.01%
Alternate · PRB · No. 10600
Coalition: PRB / PHS / PR / AVANTE
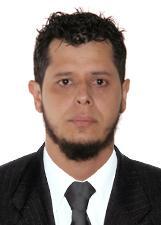
554Professor Jesus283<0.01%
Alternate · PV · No. 43357
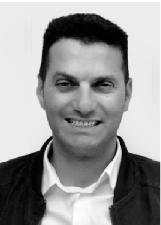
555Bibersson Cesar-Cidadão Fiscal283<0.01%
Alternate · PPL · No. 54007
Coalition: REDE / DC / PPL
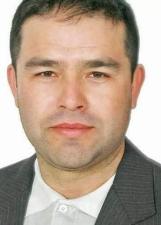
556Marcelo da Frota282<0.01%
PSOL · No. 50021
Coalition: PSOL / PCB
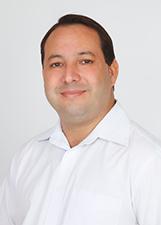
557Marcio Peixoto281<0.01%
PSOL · No. 50567
Coalition: PSOL / PCB
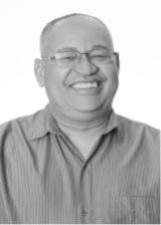
558Etevaldo Trindade281<0.01%
Alternate · PROS · No. 90777
Coalition: PROS / PMB / PMN

559Iracema Campos281<0.01%
Alternate · PT · No. 13220
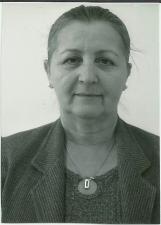
560Alzyra279<0.01%
Alternate · PHS · No. 31800
Coalition: PRB / PHS / PR / AVANTE

561Rosa279<0.01%
Alternate · PP · No. 11888
Coalition: PP / PTB / DEM / PSDB / PSB
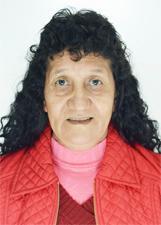
562Nevinha278<0.01%
Alternate · DC · No. 27222
Coalition: REDE / DC / PPL
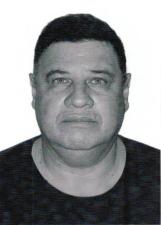
563Everson Carlos Ostrovski277<0.01%
Alternate · PATRI · No. 51153
564Eliane Schiebel274<0.01%
Alternate · PHS · No. 31279
Coalition: PRB / PHS / PR / AVANTE
565Dona Ilda270<0.01%
Alternate · PPS · No. 23030
566Valerio Cavalheiro267<0.01%
Alternate · PPS · No. 23028
567Sperandio262<0.01%
Alternate · PV · No. 43005
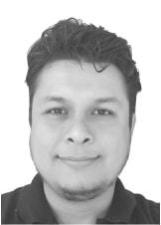
568Marcelo Bianconi262<0.01%
Alternate · REDE · No. 18180
Coalition: REDE / DC / PPL
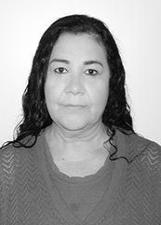
569Nice Voluntária Social260<0.01%
Alternate · PPS · No. 23133
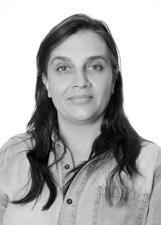
570Professora Adriana258<0.01%
Alternate · PROS · No. 90555
Coalition: PROS / PMB / PMN
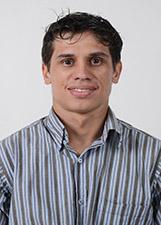
571Rafinha258<0.01%
Alternate · PRTB · No. 28920
Coalition: PRTB / PRP
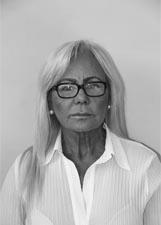
572Eva Ribeiro257<0.01%
Alternate · PRP · No. 44101
Coalition: PRTB / PRP
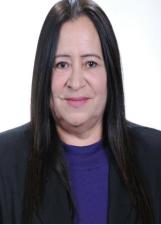
573Nadir Mariano254<0.01%
Alternate · PRB · No. 10258
Coalition: PRB / PHS / PR / AVANTE
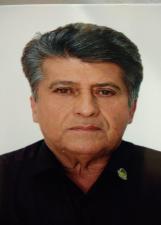
574Gilhart253<0.01%
Alternate · PRTB · No. 28610
Coalition: PRTB / PRP
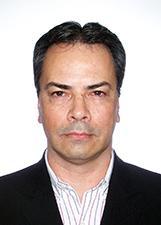
575Gilberto Jose252<0.01%
Alternate · PODE · No. 19007
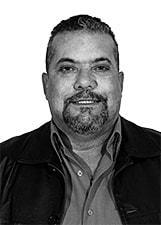
576Sansão Mariano250<0.01%
Alternate · AVANTE · No. 70000
Coalition: PRB / PHS / PR / AVANTE
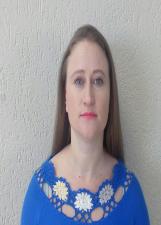
577Pedagoga Vilma250<0.01%
Alternate · MDB · No. 15001
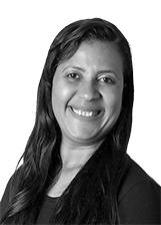
578Claudia Santos249<0.01%
Alternate · PRB · No. 10987
Coalition: PRB / PHS / PR / AVANTE
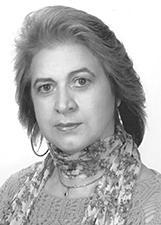
579Rosemari Kalluf246<0.01%
Alternate · PRP · No. 44111
Coalition: PRTB / PRP
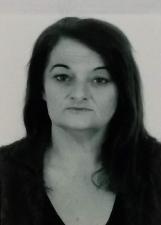
580Cida do Vale244<0.01%
Alternate · PSL · No. 17255
Coalition: PSL / PTC / PATRIOTA
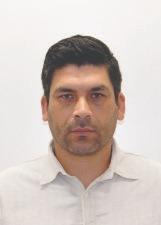
581Esquerdinha244<0.01%
Alternate · PMN · No. 33677
Coalition: PROS / PMB / PMN
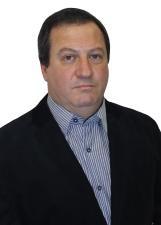
582Tata Mecânico243<0.01%
Alternate · DEM · No. 25789
Coalition: PP / PTB / DEM / PSDB / PSB
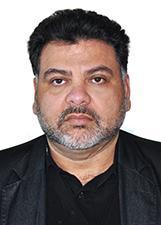
583Pastor Luciano Baruk241<0.01%
Alternate · PODE · No. 19200
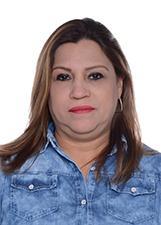
584Meire Monteiro239<0.01%
Alternate · PV · No. 43001

585Leovir234<0.01%
Alternate · PHS · No. 31032
Coalition: PRB / PHS / PR / AVANTE

586Junior Libras Rasbolt234<0.01%
Alternate · REDE · No. 18026
Coalition: REDE / DC / PPL
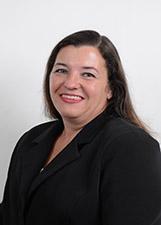
587Irma Graff232<0.01%
Alternate · PRTB · No. 28137
Coalition: PRTB / PRP
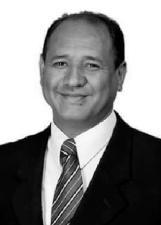
588Edvaldo Sintra231<0.01%
Alternate · PPL · No. 54333
Coalition: REDE / DC / PPL
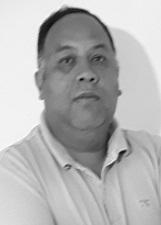
589Adelir Padilha231<0.01%
Alternate · REDE · No. 18988
Coalition: REDE / DC / PPL
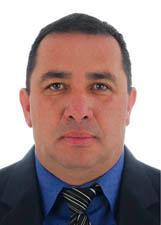
590Luiz da Ambulância229<0.01%
Alternate · PV · No. 43192

591Professor Mauricio Bastos226<0.01%
Alternate · PMN · No. 33000
Coalition: PROS / PMB / PMN

592Ana Lúcia225<0.01%
Alternate · PV · No. 43711

593Jocimar Oliveira219<0.01%
Alternate · PRTB · No. 28129
Coalition: PRTB / PRP
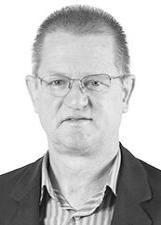
594Parana Valdecir Gielda218<0.01%
Alternate · PPS · No. 23111
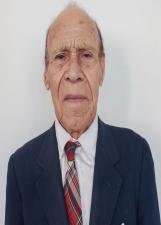
595Barão da Kombi Verde215<0.01%
Alternate · MDB · No. 15219
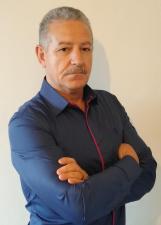
596Ezoel Padilha212<0.01%
Alternate · PSD · No. 55512
Coalition: PSC / PSD
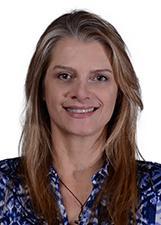
597Iza Montanha211<0.01%
Alternate · PROS · No. 90911
Coalition: PROS / PMB / PMN
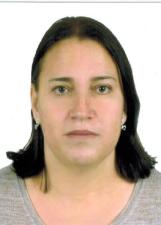
598Jane204<0.01%
Alternate · PSB · No. 40356
Coalition: PP / PTB / DEM / PSDB / PSB
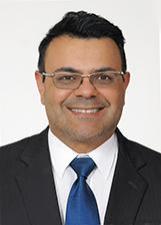
599Omar Simon199<0.01%
Alternate · PODE · No. 19555
600Cris197<0.01%
Alternate · PRP · No. 44445
Coalition: PRTB / PRP
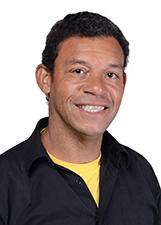
601Rogério Marques do Vista Bela196<0.01%
Alternate · PROS · No. 90700
Coalition: PROS / PMB / PMN

602Clarice Anelli196<0.01%
Alternate · PSL · No. 17357
Coalition: PSL / PTC / PATRIOTA
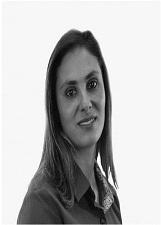
603Cristiane Palhano193<0.01%
Alternate · PRB · No. 10885
Coalition: PRB / PHS / PR / AVANTE
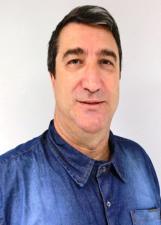
604Cabo Frederico193<0.01%
Alternate · PRTB · No. 28357
Coalition: PRTB / PRP

605Cesário Marconcin191<0.01%
Alternate · MDB · No. 15060

606Laira Gomes187<0.01%
Alternate · PSC · No. 20024
Coalition: PSC / PSD
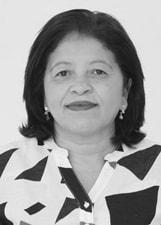
607Maria do Brecho186<0.01%
Alternate · PSC · No. 20010
Coalition: PSC / PSD
608Polichuk184<0.01%
Alternate · PV · No. 43112
609Marcelo184<0.01%
Alternate · PROS · No. 90113
Coalition: PROS / PMB / PMN
610Arnaldo Milki183<0.01%
Alternate · PRB · No. 10125
Coalition: PRB / PHS / PR / AVANTE
611Sidrin NOVO183<0.01%
Alternate · PRTB · No. 28018
Coalition: PRTB / PRP
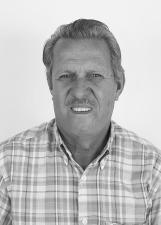
612Osvaldo Cabeção177<0.01%
Alternate · PTC · No. 36126
Coalition: PSL / PTC / PATRIOTA
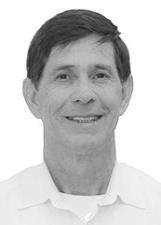
613Volmir Golçalves177<0.01%
Alternate · PPS · No. 23069

614Elenice Freitas de Jesus175<0.01%
Alternate · PRB · No. 10090
Coalition: PRB / PHS / PR / AVANTE
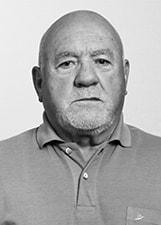
615Policial Carneiro172<0.01%
Alternate · PSC · No. 20045
Coalition: PSC / PSD
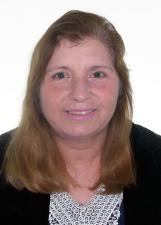
616Marlene Soares171<0.01%
Alternate · PODE · No. 19198
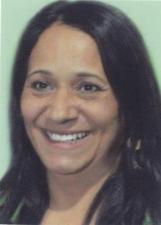
617Edneia Maria170<0.01%
Alternate · PV · No. 43012
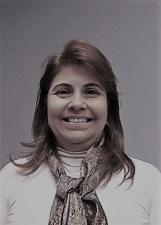
618Soraya Oliveira168<0.01%
Alternate · PTC · No. 36336
Coalition: PSL / PTC / PATRIOTA
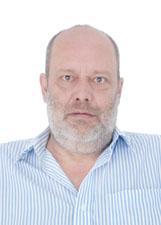
619Julião Beira168<0.01%
Alternate · PMN · No. 33055
Coalition: PROS / PMB / PMN
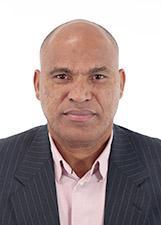
620Muzamba Silvano165<0.01%
PSOL · No. 50050
Coalition: PSOL / PCB
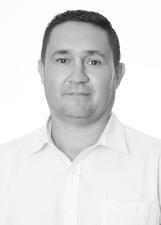
621Sandro Correa164<0.01%
Alternate · PROS · No. 90222
Coalition: PROS / PMB / PMN
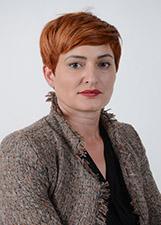
622Sonia Borges163<0.01%
Alternate · PRTB · No. 28199
Coalition: PRTB / PRP
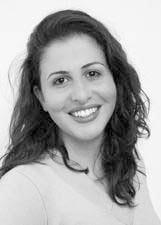
623Fernanda Bonato162<0.01%
Alternate · PRP · No. 44777
Coalition: PRTB / PRP
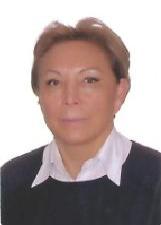
624Blanca Vianna153<0.01%
Alternate · PP · No. 11088
Coalition: PP / PTB / DEM / PSDB / PSB
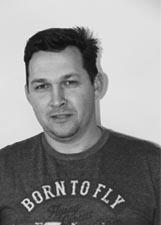
625Kafubira Santos153<0.01%
Alternate · PRP · No. 44156
Coalition: PRTB / PRP
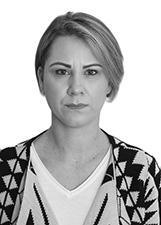
626Jaqueline Bravin152<0.01%
Alternate · PSC · No. 20018
Coalition: PSC / PSD
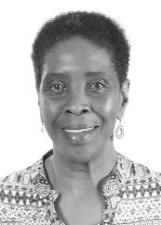
627Sueli Costa152<0.01%
Alternate · PPS · No. 23780

628Roseli Garçonete150<0.01%
Alternate · PRP · No. 44404
Coalition: PRTB / PRP
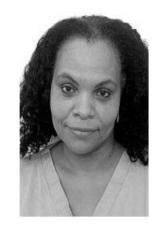
629Rosangela de Lima149<0.01%
Alternate · PC do B · No. 65123
Coalition: PDT / SOLIDARIEDADE / PC do B
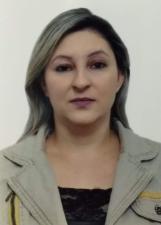
630Jessica Puszka147<0.01%
Alternate · PSL · No. 17611
Coalition: PSL / PTC / PATRIOTA
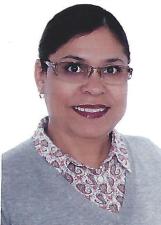
631Marlene147<0.01%
Alternate · PMN · No. 33100
Coalition: PROS / PMB / PMN
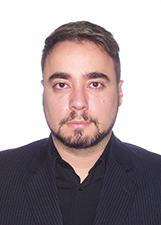
632Eduardo Barancelli146<0.01%
Alternate · PODE · No. 19081

633Dra Silvia Ribeiro138<0.01%
Alternate · PPS · No. 23700

634Alessandro Frezatto138<0.01%
Alternate · PPS · No. 23934
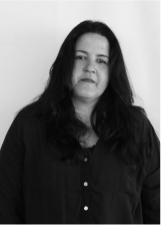
635Maria Lucia137<0.01%
Alternate · PROS · No. 90120
Coalition: PROS / PMB / PMN
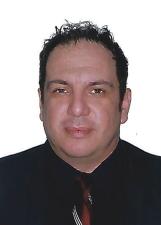
636Mauricio Fortes Alcantara137<0.01%
Alternate · PMN · No. 33663
Coalition: PROS / PMB / PMN
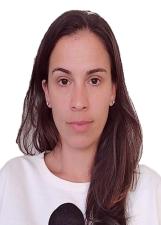
637Janaina Ebrahim134<0.01%
Alternate · PSL · No. 17654
Coalition: PSL / PTC / PATRIOTA
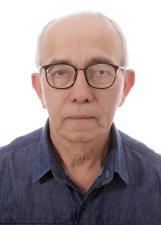
638Pobretão133<0.01%
PSOL · No. 50310
Coalition: PSOL / PCB
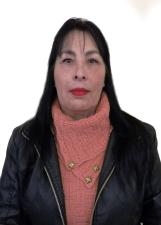
639Ilda Furacao130<0.01%
Alternate · DC · No. 27115
Coalition: REDE / DC / PPL
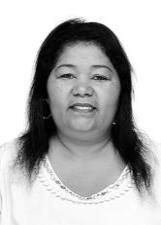
640Cida Laurindo129<0.01%
Alternate · PRB · No. 10789
Coalition: PRB / PHS / PR / AVANTE
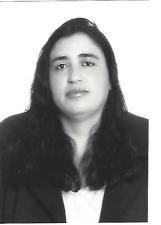
641Angela Paulista129<0.01%
Alternate · PRB · No. 10726
Coalition: PRB / PHS / PR / AVANTE
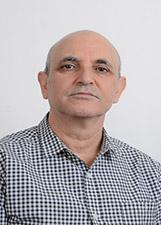
642Dr. Talel129<0.01%
Alternate · PRTB · No. 28229
Coalition: PRTB / PRP
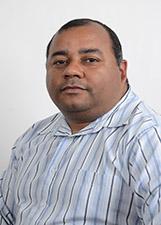
643Ricardo da Serra129<0.01%
Alternate · PRTB · No. 28428
Coalition: PRTB / PRP

644Wania Godoi128<0.01%
Alternate · PP · No. 11033
Coalition: PP / PTB / DEM / PSDB / PSB
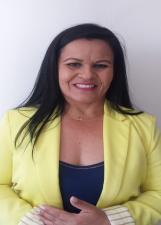
645Débora Brasil128<0.01%
Alternate · DC · No. 27456
Coalition: REDE / DC / PPL

646Silvia Aparecida Cordeiro123<0.01%
Alternate · PSC · No. 20016
Coalition: PSC / PSD

647Ana Vale123<0.01%
Alternate · PROS · No. 90678
Coalition: PROS / PMB / PMN
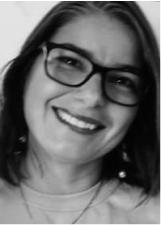
648Roseli123<0.01%
Alternate · PMB · No. 35333
Coalition: PROS / PMB / PMN
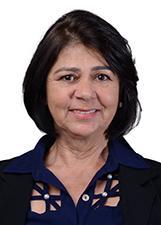
649Margarete122<0.01%
Alternate · PMB · No. 35015
Coalition: PROS / PMB / PMN
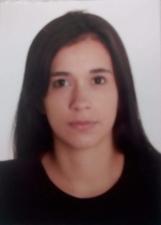
650Paloma Bauer120<0.01%
Alternate · PTC · No. 36790
Coalition: PSL / PTC / PATRIOTA
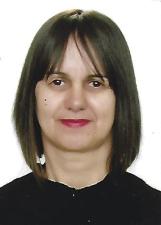
651Carmen Custodio120<0.01%
Alternate · PMN · No. 33999
Coalition: PROS / PMB / PMN
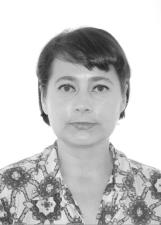
652Patricia Oliveira119<0.01%
Alternate · PTC · No. 36333
Coalition: PSL / PTC / PATRIOTA
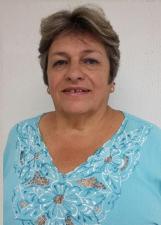
653Rosângela Mendes116<0.01%
Alternate · PODE · No. 19370

654Neuci Carvalho115<0.01%
Alternate · PROS · No. 90313
Coalition: PROS / PMB / PMN

655Alessandra Madureira114<0.01%
Alternate · PRTB · No. 28002
Coalition: PRTB / PRP
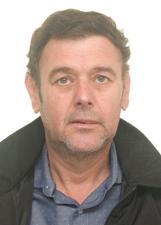
656Dentinho110<0.01%
Alternate · PMN · No. 33103
Coalition: PROS / PMB / PMN
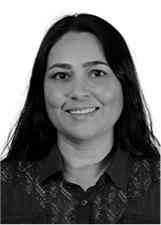
657Joana Pereira109<0.01%
Alternate · PROS · No. 90790
Coalition: PROS / PMB / PMN
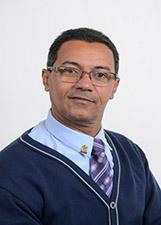
658Pastor Wellington Dias109<0.01%
Alternate · PRTB · No. 28126
Coalition: PRTB / PRP
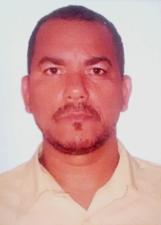
659Xerles Guilherme107<0.01%
PSOL · No. 50321
Coalition: PSOL / PCB
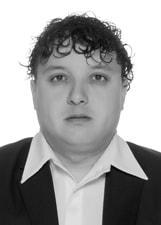
660Glauber do Oleo107<0.01%
Alternate · PSC · No. 20055
Coalition: PSC / PSD

661Wanda Koque105<0.01%
Alternate · PROS · No. 90029
Coalition: PROS / PMB / PMN
662Lucia Lemes da Silva104<0.01%
Alternate · PV · No. 43936
663Patricia Mattos104<0.01%
Alternate · PPS · No. 23737
664Drumond103<0.01%
Alternate · PV · No. 43431
665Professor Fernando100<0.01%
PSOL · No. 50022
Coalition: PSOL / PCB

666Solani Santos100<0.01%
Alternate · PRB · No. 10234
Coalition: PRB / PHS / PR / AVANTE
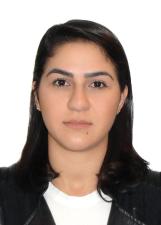
667Vanessa Ribeiro Giareta99<0.01%
Alternate · PV · No. 43777
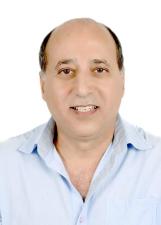
668Marcos Abujamra99<0.01%
Alternate · REDE · No. 18369
Coalition: REDE / DC / PPL
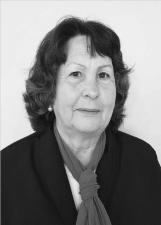
669Fatima Carvalho98<0.01%
Alternate · AVANTE · No. 70565
Coalition: PRB / PHS / PR / AVANTE
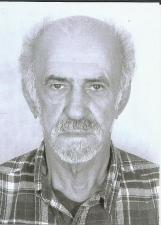
670Ze Ramalho86<0.01%
Alternate · PHS · No. 31071
Coalition: PRB / PHS / PR / AVANTE

671Raphaela Carvalho84<0.01%
Alternate · PPL · No. 54700
Coalition: REDE / DC / PPL
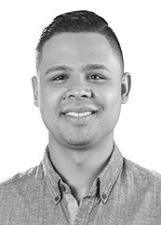
672Arthur Rusik83<0.01%
Alternate · PPS · No. 23402
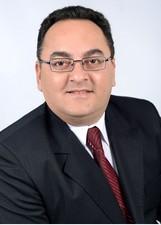
673Professor Marcio Menezes82<0.01%
Alternate · PSC · No. 20030
Coalition: PSC / PSD
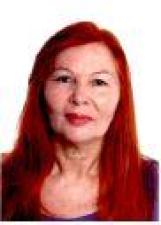
674Nair Tartari78<0.01%
Alternate · PV · No. 43434
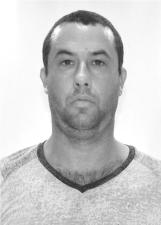
675Amazonas77<0.01%
Alternate · PATRI · No. 51121
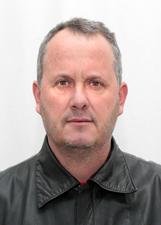
676Joecir Bernardi77<0.01%
Alternate · SOLIDARIEDADE · No. 77789
Coalition: PDT / SOLIDARIEDADE / PC do B

677Luiz Com Z75<0.01%
Alternate · PROS · No. 90444
Coalition: PROS / PMB / PMN

678Rita Tanara da Silva74<0.01%
Alternate · PSC · No. 20006
Coalition: PSC / PSD

679Liza Ramos68<0.01%
Alternate · PROS · No. 90403
Coalition: PROS / PMB / PMN

680Sirlanne Rocha67<0.01%
Alternate · PV · No. 43327
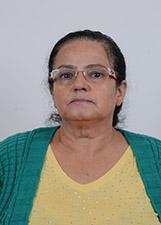
681Neildes Aragão66<0.01%
Alternate · PRTB · No. 28021
Coalition: PRTB / PRP
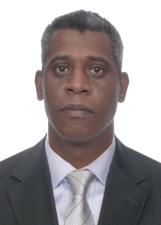
682Lucas Santos66<0.01%
Alternate · DC · No. 27123
Coalition: REDE / DC / PPL
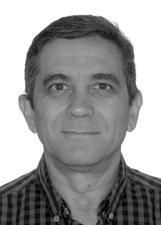
683Eng Édi65<0.01%
Alternate · PV · No. 43365

684Angelica Bastos63<0.01%
Alternate · PMN · No. 33707
Coalition: PROS / PMB / PMN
685Criméria59<0.01%
Alternate · PRTB · No. 28678
Coalition: PRTB / PRP

686Meriã Rocha58<0.01%
Alternate · PODE · No. 19077
687Dr Garcia Neto55<0.01%
Alternate · PRTB · No. 28282
Coalition: PRTB / PRP
688Mery48<0.01%
Alternate · PRTB · No. 28140
Coalition: PRTB / PRP
689Branca48<0.01%
Alternate · PMN · No. 33900
Coalition: PROS / PMB / PMN

690Simone Braga45<0.01%
Alternate · PRP · No. 44020
Coalition: PRTB / PRP

691Veviane Darodda45<0.01%
Alternate · PSB · No. 40081
Coalition: PP / PTB / DEM / PSDB / PSB
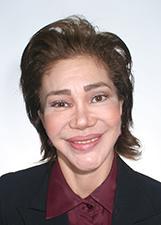
692Ciça dos Anjos39<0.01%
Alternate · PODE · No. 19091

693Francielle Goes39<0.01%
Alternate · PPL · No. 54550
Coalition: REDE / DC / PPL
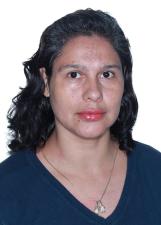
694Juliane de Abreu Veiga36<0.01%
Alternate · PV · No. 43553
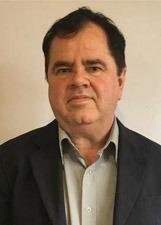
695Professor Seleme33<0.01%
Alternate · PRTB · No. 28555
Coalition: PRTB / PRP
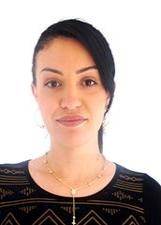
696Juliana Araujo32<0.01%
Alternate · PMN · No. 33588
Coalition: PROS / PMB / PMN

697Sheila Novais27<0.01%
Alternate · PRTB · No. 28022
Coalition: PRTB / PRP
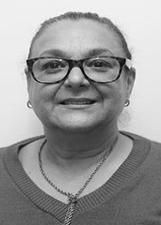
698Solange Terebinto25<0.01%
Alternate · PATRI · No. 51260
699Nara Cristina22<0.01%
Alternate · PV · No. 43321
700Sandra Sales19<0.01%
Alternate · PRTB · No. 28020
Coalition: PRTB / PRP
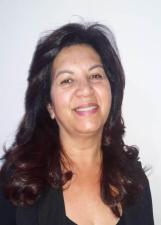
701Celia Estudio Sachas13<0.01%
Alternate · PRTB · No. 28150
Coalition: PRTB / PRP
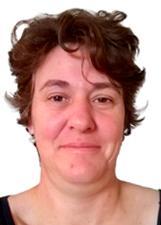
702Salete11<0.01%
Alternate · PMN · No. 33448
Coalition: PROS / PMB / PMN
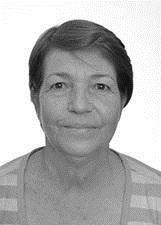
703Marili9<0.01%
Alternate · PODE · No. 19002
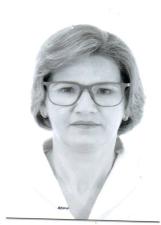
704Juraci Cover Custodio da Luz8<0.01%
Alternate · PRP · No. 44951
Coalition: PRTB / PRP
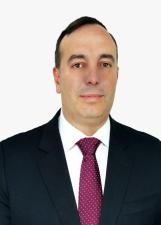
—Delegado Francischini427,749
Annulled votesRevoked · PSL · No. 17777

—Subtenente Everton13,047
Annulled votesRevoked · PSL · No. 17900
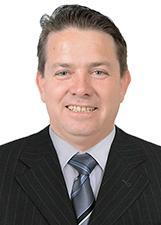
—Zinho Machado2,004
Annulled votesRejected · PODE · No. 19345
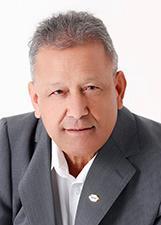
—Custodio da Silva1,850
Annulled votesRejected · PMN · No. 33360
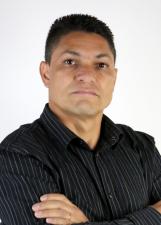
—Supervisor Aparecido526
Annulled votesRejected · PATRIOTA · No. 51190
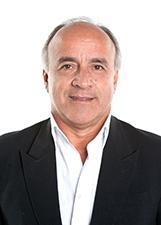
—Renato Cara Nova498
Annulled votesRejected · DC · No. 27777
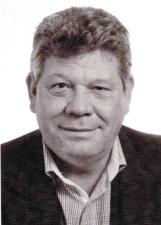
—Paulo Borlachenco495
Annulled votesRejected · PATRIOTA · No. 51051

—Nina Singer452
Annulled votesWithdrawal · DEM · No. 25125
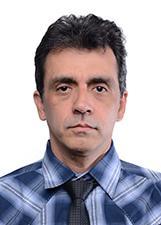
—Adriano Azevedo421
Annulled votesRejected · PROS · No. 90100
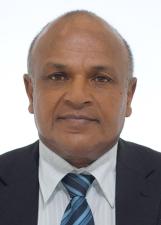
—Jose Carlos Ferreira405
Annulled votesRejected · PTC · No. 36777
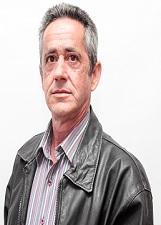
—Paulo Rodrigues365
Annulled votesRequest not considered · PATRIOTA · No. 51456
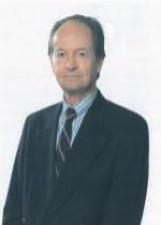
—Romeu Friedlaender352
Annulled votesRejected · PMN · No. 33022
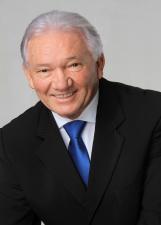
—Nelson Tureck295
Annulled votesRejected · PODE · No. 19151
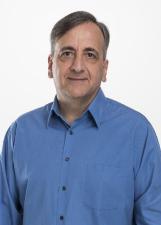
—Paulo Colnaghi289
Annulled votesRejected · PV · No. 43007

—Aline Cardoso263
Annulled votesRejected · PSL · No. 17696
—Cleomar Gauchão do Paver247
Annulled votesRejected · PT · No. 13555
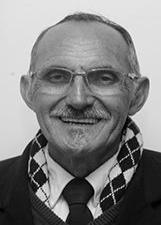
—Pedro Tigrão165
Annulled votesRejected · PATRIOTA · No. 51250
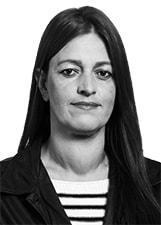
—Andreia152
Annulled votesRejected · PSC · No. 20015

—Joel Santos Martins143
Annulled votesRejected · PTC · No. 36011
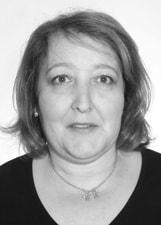
—Roberta Santos139
Annulled votesRejected · AVANTE · No. 70055

—Manoel Miranda131
Annulled votesRejected · REDE · No. 18900
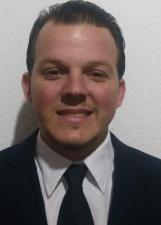
—Rui Nascimento128
Annulled votesRejected · PSOL · No. 50667

—Berenice Bolfe117
Annulled votesRejected · PATRIOTA · No. 51512
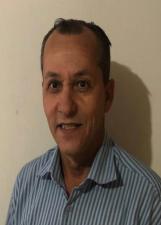
—Erivaldo da Vila Rural116
Annulled votesRejected · MDB · No. 15133
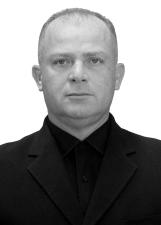
—Floriano Pereira76
Annulled votesRejected · PATRIOTA · No. 51333
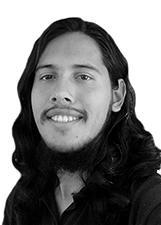
—Roberto Andrade75
Annulled votesWithdrawal · REDE · No. 18222
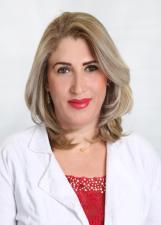
—Diva66
Annulled votesWithdrawal · PODE · No. 19422
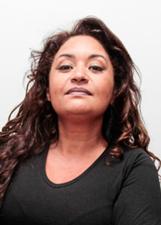
—Luciane Martins64
Annulled votesRejected · PATRIOTA · No. 51111
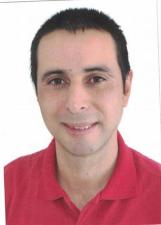
—Ricardo Antunes Lara57
Annulled votesRejected · PCO · No. 29129
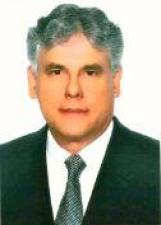
—Luiz Lucchesi44
Annulled votesWithdrawal · PSD · No. 55199
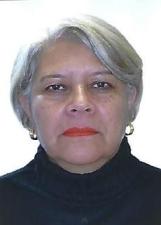
—Rosana Elias37
Annulled votesRejected · PODE · No. 19279
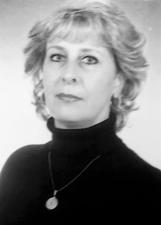
—Rosane Oleszczuk33
Annulled votesRejected · PSL · No. 17871
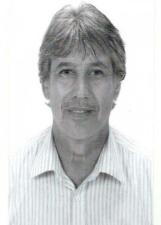
—Waldewmar do Amaral Costa32
Annulled votesRejected · PATRIOTA · No. 51510
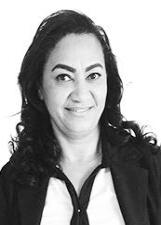
—Jeneci Pereira28
Annulled votesRejected · PPS · No. 23466
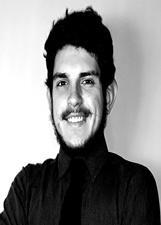
—Júlio Soares26
Annulled votesRejected · REDE · No. 18600

—Ednel da Higienópolis26
Annulled votesRejected · PSD · No. 55181
—Luciana Saporiti23
Annulled votesRejected · REDE · No. 18200
—Luciane Ribas23
Annulled votesRejected · PCO · No. 29329
—Willian Parra Machado22
Annulled votesRejected · PCO · No. 29029
—Natanael Santos20
Annulled votesRejected · PTC · No. 36477
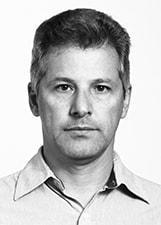
—Flavio Nakad20
Annulled votesRejected · AVANTE · No. 70999
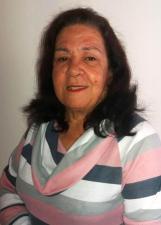
—Ivone de Jesus14
Annulled votesRejected · PRTB · No. 28122
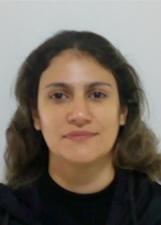
—Lu11
Annulled votesRejected · PMN · No. 33200

—Lauro Rodrigues9
Annulled votesRejected · PRTB · No. 28041
—Jenifer8
Annulled votesRejected · PV · No. 43656
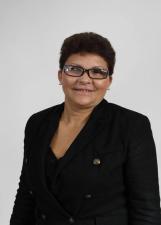
—Marli da Chacara Zoo7
Annulled votesRejected · PATRIOTA · No. 51432


