In 2018, in Piauí, 30 state deputies were elected, according to data from Brazil's Superior Electoral Court (TSE). The largest caucus was that of MDB (6). The most votes went to Georgiano (PSD), with 79,723 votes (4.39% of the valid votes). The electoral quotient was about 60,560 votes, and the lowest vote total among those elected was 17,633: seats are allocated to the party first.
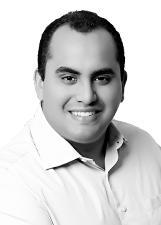
1Georgiano79,7234.39%
Elected · PSD · No. 55555
Coalition: PT / MDB / PP / PR / PDT / PSD / PC do B / PTB / PRTB
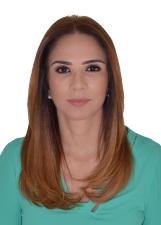
2Lucy57,3843.16%
Elected · PP · No. 11456
Coalition: PT / MDB / PP / PR / PDT / PSD / PC do B / PTB / PRTB
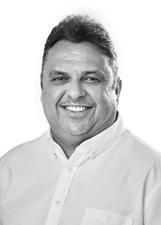
3Julio Arcoverde49,6882.73%
Elected · PP · No. 11111
Coalition: PT / MDB / PP / PR / PDT / PSD / PC do B / PTB / PRTB

4Wilson Brandão47,9082.64%
Elected · PP · No. 11140
Coalition: PT / MDB / PP / PR / PDT / PSD / PC do B / PTB / PRTB
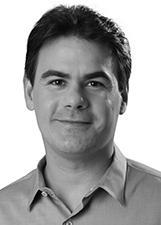
5Severo Eulalio47,1752.60%
Elected · MDB · No. 15101
Coalition: PT / MDB / PP / PR / PDT / PSD / PC do B / PTB / PRTB
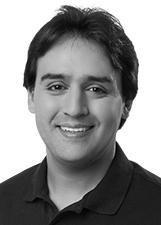
6Flavio Nogueira Jr47,0072.59%
Elected · PDT · No. 12369
Coalition: PT / MDB / PP / PR / PDT / PSD / PC do B / PTB / PRTB
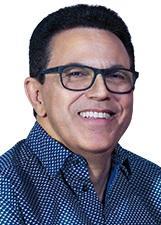
7Zé Santana45,8132.52%
Elected · MDB · No. 15110
Coalition: PT / MDB / PP / PR / PDT / PSD / PC do B / PTB / PRTB
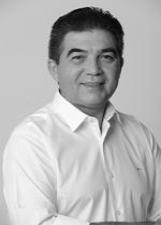
8Limma44,2342.43%
Elected · PT · No. 13123
Coalition: PT / MDB / PP / PR / PDT / PSD / PC do B / PTB / PRTB

9Themistocles Filho42,7732.35%
Elected · MDB · No. 15111
Coalition: PT / MDB / PP / PR / PDT / PSD / PC do B / PTB / PRTB
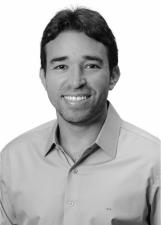
10Marden Meneses42,0962.32%
Elected · PSDB · No. 45555
Coalition: PSDB / DEM / PSB
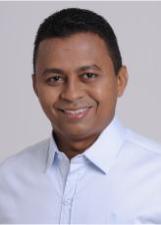
11Dr. Francisco Costa41,9662.31%
Elected · PT · No. 13456
Coalition: PT / MDB / PP / PR / PDT / PSD / PC do B / PTB / PRTB
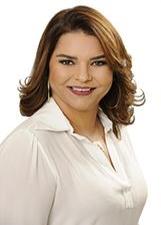
12Janainna Marques41,6532.29%
Elected · PTB · No. 14123
Coalition: PT / MDB / PP / PR / PDT / PSD / PC do B / PTB / PRTB
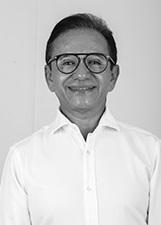
13Dr. Hélio38,3912.11%
Elected · PR · No. 22333
Coalition: PT / MDB / PP / PR / PDT / PSD / PC do B / PTB / PRTB
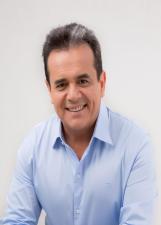
14Henrique Pires38,3462.11%
Elected · MDB · No. 15123
Coalition: PT / MDB / PP / PR / PDT / PSD / PC do B / PTB / PRTB

15Pablo Santos38,1772.10%
Elected · MDB · No. 15199
Coalition: PT / MDB / PP / PR / PDT / PSD / PC do B / PTB / PRTB
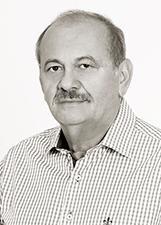
16Fernando Monteiro36,8522.03%
Elected · PRTB · No. 28114
Coalition: PT / MDB / PP / PR / PDT / PSD / PC do B / PTB / PRTB
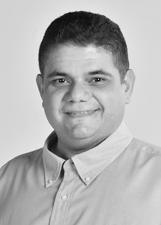
17Fábio Xavier35,7791.97%
Elected · PR · No. 22222
Coalition: PT / MDB / PP / PR / PDT / PSD / PC do B / PTB / PRTB

18Fabio NOVO35,7141.97%
Elected · PT · No. 13111
Coalition: PT / MDB / PP / PR / PDT / PSD / PC do B / PTB / PRTB
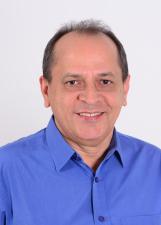
19Hélio Isaias35,3581.95%
Elected · PP · No. 11454
Coalition: PT / MDB / PP / PR / PDT / PSD / PC do B / PTB / PRTB

20Gustavo Neiva34,6621.91%
Elected · PSB · No. 40555
Coalition: PSDB / DEM / PSB
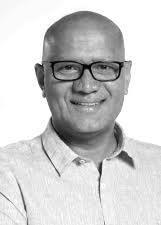
21Franzé Silva31,5261.74%
Elected · PT · No. 13333
Coalition: PT / MDB / PP / PR / PDT / PSD / PC do B / PTB / PRTB
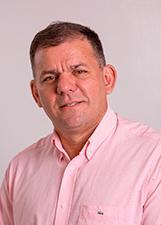
22Coronel Carlos Augusto30,8101.70%
Elected · PR · No. 22111
Coalition: PT / MDB / PP / PR / PDT / PSD / PC do B / PTB / PRTB
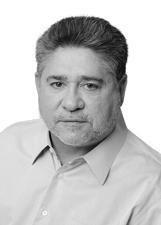
23João Madison30,1181.66%
Elected · MDB · No. 15555
Coalition: PT / MDB / PP / PR / PDT / PSD / PC do B / PTB / PRTB
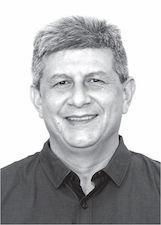
24Zé Filho29,1001.60%
Alternate · PSDB · No. 45130
Coalition: PSDB / DEM / PSB

25Flora Izabel29,0611.60%
Elected · PT · No. 13678
Coalition: PT / MDB / PP / PR / PDT / PSD / PC do B / PTB / PRTB

26Pastor Gessivaldo28,2591.56%
Elected · PRB · No. 10123
Coalition: PMN / PRB / SOLIDARIEDADE / PPL / PTC
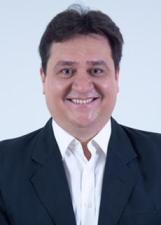
27Nerinho27,6841.52%
Elected (remainder seat) · PTB · No. 14000
Coalition: PT / MDB / PP / PR / PDT / PSD / PC do B / PTB / PRTB
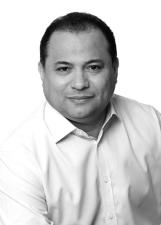
28Evaldo Gomes26,8511.48%
Elected · PTC · No. 36789
Coalition: PMN / PRB / SOLIDARIEDADE / PPL / PTC
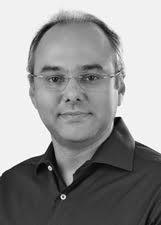
29Firmino Paulo26,6921.47%
Elected (remainder seat) · PP · No. 11789
Coalition: PT / MDB / PP / PR / PDT / PSD / PC do B / PTB / PRTB

30B. Sá23,9301.32%
Alternate · PP · No. 11000
Coalition: PT / MDB / PP / PR / PDT / PSD / PC do B / PTB / PRTB
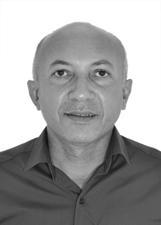
31Warton Lacerda23,7951.31%
Alternate · PT · No. 13444
Coalition: PT / MDB / PP / PR / PDT / PSD / PC do B / PTB / PRTB
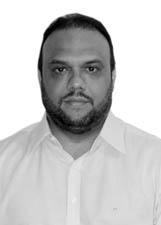
32Ziza Carvalho23,5741.30%
Alternate · PT · No. 13555
Coalition: PT / MDB / PP / PR / PDT / PSD / PC do B / PTB / PRTB
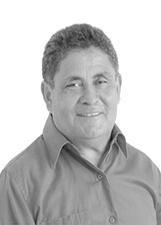
33Magalhães22,8881.26%
Alternate · PT · No. 13567
Coalition: PT / MDB / PP / PR / PDT / PSD / PC do B / PTB / PRTB
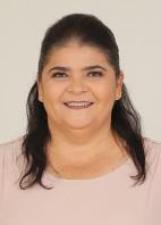
34Belê Medeiros21,5841.19%
Alternate · PP · No. 11222
Coalition: PT / MDB / PP / PR / PDT / PSD / PC do B / PTB / PRTB
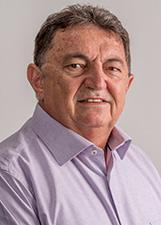
35Rubem Martins21,0021.16%
Alternate · PSB · No. 40123
Coalition: PSDB / DEM / PSB
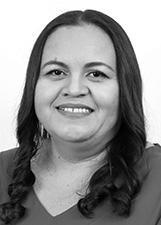
36Elisangela Moura20,9971.16%
Alternate · PC do B · No. 65123
Coalition: PT / MDB / PP / PR / PDT / PSD / PC do B / PTB / PRTB
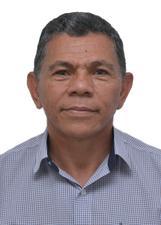
37Joao de Deus19,5931.08%
Alternate · PT · No. 13222
Coalition: PT / MDB / PP / PR / PDT / PSD / PC do B / PTB / PRTB

38Teresa Britto19,5321.08%
Elected · PV · No. 43333
Coalition: PODE / PV / PRP / PATRIOTA / PPS / AVANTE / REDE / PHS

39Paulo Martins19,1581.05%
Alternate · PT · No. 13252
Coalition: PT / MDB / PP / PR / PDT / PSD / PC do B / PTB / PRTB

40Liziê Coelho18,3181.01%
Alternate · MDB · No. 15789
Coalition: PT / MDB / PP / PR / PDT / PSD / PC do B / PTB / PRTB
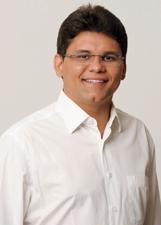
41Oliveira Neto17,6330.97%
Elected · PPS · No. 23456
Coalition: PODE / PV / PRP / PATRIOTA / PPS / AVANTE / REDE / PHS
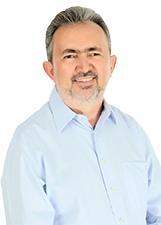
42Antônio Felix16,9460.93%
Alternate · PTC · No. 36123
Coalition: PMN / PRB / SOLIDARIEDADE / PPL / PTC
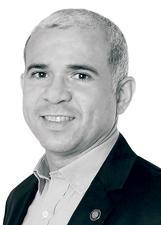
43Tiago Vasconcelos15,9050.88%
Alternate · PHS · No. 31321
Coalition: PODE / PV / PRP / PATRIOTA / PPS / AVANTE / REDE / PHS

44Jôve14,1990.78%
Alternate · PTB · No. 14777
Coalition: PT / MDB / PP / PR / PDT / PSD / PC do B / PTB / PRTB
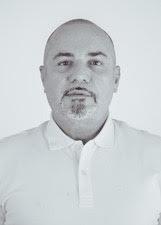
45Henrique Rebelo10,3770.57%
Alternate · PTC · No. 36111
Coalition: PMN / PRB / SOLIDARIEDADE / PPL / PTC

46Capitão Anderson10,2950.57%
PSL · No. 17123
Coalition: PROS / PSL
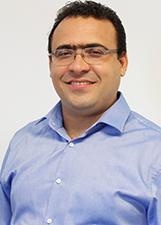
47Dr. Lazáro9,1490.50%
Alternate · PPS · No. 23192
Coalition: PODE / PV / PRP / PATRIOTA / PPS / AVANTE / REDE / PHS

48Valdemir Virgino8,9480.49%
Alternate · PRP · No. 44567
Coalition: PODE / PV / PRP / PATRIOTA / PPS / AVANTE / REDE / PHS
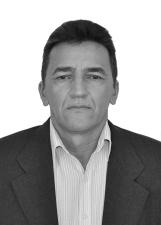
49Deusimar O Terere8,3250.46%
Alternate · PTC · No. 36999
Coalition: PMN / PRB / SOLIDARIEDADE / PPL / PTC
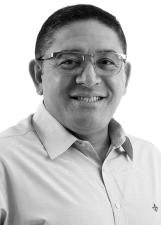
50Sérgio Bandeira8,2710.46%
Alternate · PODE · No. 19123
Coalition: PODE / PV / PRP / PATRIOTA / PPS / AVANTE / REDE / PHS
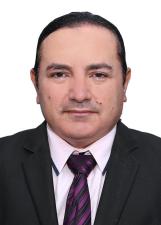
51Francis Lopes7,3230.40%
Alternate · PTC · No. 36333
Coalition: PMN / PRB / SOLIDARIEDADE / PPL / PTC
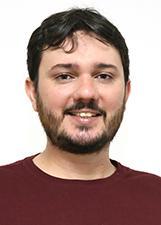
52Floro Mauel7,2490.40%
Alternate · PC do B · No. 65222
Coalition: PT / MDB / PP / PR / PDT / PSD / PC do B / PTB / PRTB
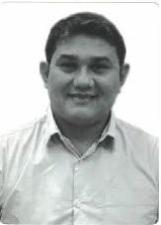
53Joãozinho Unimagem da Parnaíba6,4370.35%
Alternate · PRTB · No. 28555
Coalition: PT / MDB / PP / PR / PDT / PSD / PC do B / PTB / PRTB
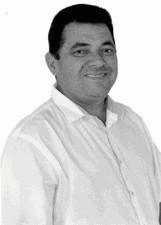
54Luiz Neto6,0320.33%
Alternate · PRP · No. 44123
Coalition: PODE / PV / PRP / PATRIOTA / PPS / AVANTE / REDE / PHS
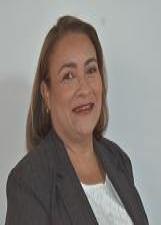
55Raimundinha da Pesca5,3820.30%
Alternate · SOLIDARIEDADE · No. 77555
Coalition: PMN / PRB / SOLIDARIEDADE / PPL / PTC
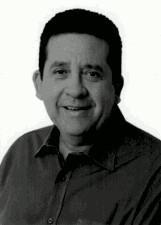
56Paulo Roberto da Iluminação4,6520.26%
Alternate · PRP · No. 44789
Coalition: PODE / PV / PRP / PATRIOTA / PPS / AVANTE / REDE / PHS
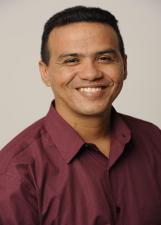
57Genaldo Sousa Ace/acs4,4240.24%
Alternate · PHS · No. 31051
Coalition: PODE / PV / PRP / PATRIOTA / PPS / AVANTE / REDE / PHS
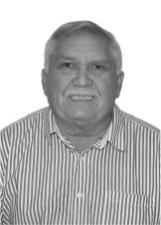
58Delegado Menandro Pedro4,3700.24%
Alternate · SOLIDARIEDADE · No. 77222
Coalition: PMN / PRB / SOLIDARIEDADE / PPL / PTC
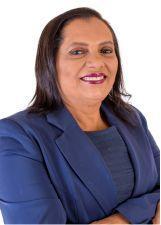
59Dr. Emilia4,3180.24%
Alternate · AVANTE · No. 70000
Coalition: PODE / PV / PRP / PATRIOTA / PPS / AVANTE / REDE / PHS
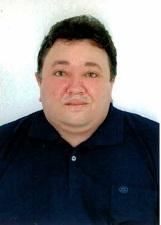
60Bilu4,2380.23%
Alternate · MDB · No. 15000
Coalition: PT / MDB / PP / PR / PDT / PSD / PC do B / PTB / PRTB
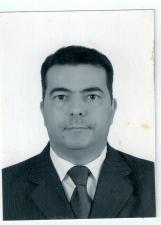
61Sâmio Falcão3,7660.21%
Alternate · PHS · No. 31000
Coalition: PODE / PV / PRP / PATRIOTA / PPS / AVANTE / REDE / PHS
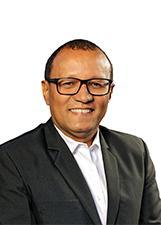
62Devan Eugênio3,5930.20%
Alternate · PR · No. 22123
Coalition: PT / MDB / PP / PR / PDT / PSD / PC do B / PTB / PRTB
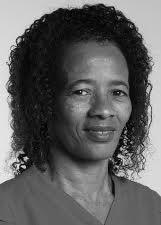
63Maria do Povo2,8250.16%
Alternate · PT · No. 13300
Coalition: PT / MDB / PP / PR / PDT / PSD / PC do B / PTB / PRTB
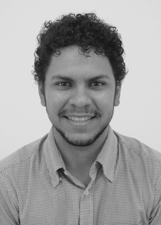
64Emerson Sammuel2,4400.13%
PSOL · No. 50123
Coalition: PSOL / PCB
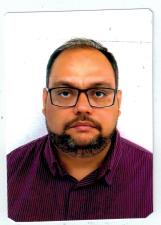
65Ricardo Amorim2,4240.13%
Alternate · PHS · No. 31777
Coalition: PODE / PV / PRP / PATRIOTA / PPS / AVANTE / REDE / PHS
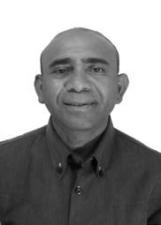
66Missionario Bill Santos2,3100.13%
Alternate · PPS · No. 23123
Coalition: PODE / PV / PRP / PATRIOTA / PPS / AVANTE / REDE / PHS
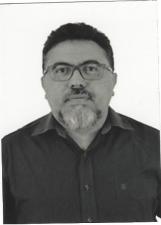
67Edson Renovato2,3070.13%
PSL · No. 17777
Coalition: PROS / PSL
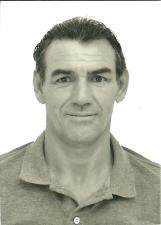
68Ronaldo Chaves2,2770.13%
Alternate · PV · No. 43888
Coalition: PODE / PV / PRP / PATRIOTA / PPS / AVANTE / REDE / PHS
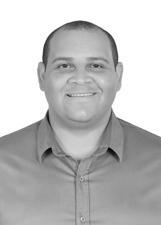
69Sargento Alder2,1870.12%
PROS · No. 90190
Coalition: PROS / PSL
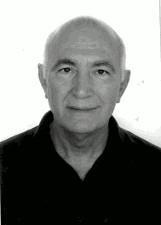
70Dr. Paulo Henrique2,1490.12%
Alternate · PRP · No. 44222
Coalition: PODE / PV / PRP / PATRIOTA / PPS / AVANTE / REDE / PHS
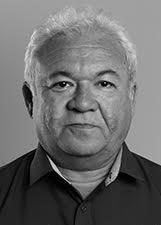
71Raimundo Pereira2,1310.12%
Alternate · PT · No. 13125
Coalition: PT / MDB / PP / PR / PDT / PSD / PC do B / PTB / PRTB

72Socorro Marques1,9600.11%
Alternate · PSB · No. 40444
Coalition: PSDB / DEM / PSB
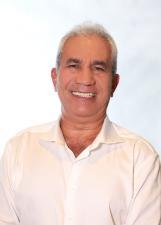
73Ze Gomes1,9570.11%
Alternate · PT · No. 13000
Coalition: PT / MDB / PP / PR / PDT / PSD / PC do B / PTB / PRTB
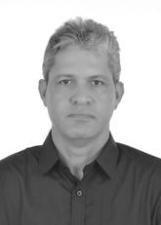
74Toni Boson1,8510.10%
PROS · No. 90444
Coalition: PROS / PSL

75Odival Andrade1,8340.10%
Alternate · PR · No. 22345
Coalition: PT / MDB / PP / PR / PDT / PSD / PC do B / PTB / PRTB
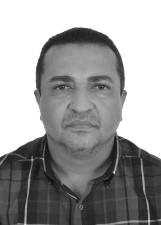
76Miranda Neto1,6860.09%
Alternate · PHS · No. 31800
Coalition: PODE / PV / PRP / PATRIOTA / PPS / AVANTE / REDE / PHS

77Vicente Sobrinho1,6160.09%
Alternate · PT · No. 13013
Coalition: PT / MDB / PP / PR / PDT / PSD / PC do B / PTB / PRTB
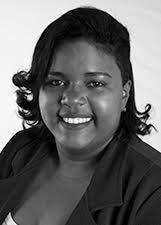
78Nayara Costa1,5560.09%
Alternate · PT · No. 13500
Coalition: PT / MDB / PP / PR / PDT / PSD / PC do B / PTB / PRTB
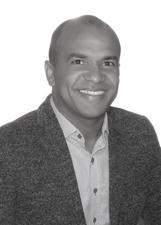
79Professor Wleiner Castelo1,5380.08%
PROS · No. 90123
Coalition: PROS / PSL
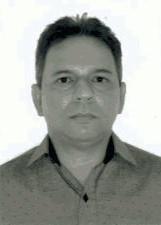
80Professor Lucídio Beserra1,5150.08%
Alternate · PRP · No. 44000
Coalition: PODE / PV / PRP / PATRIOTA / PPS / AVANTE / REDE / PHS
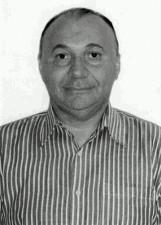
81Dr. Valdir1,4460.08%
Alternate · PRP · No. 44111
Coalition: PODE / PV / PRP / PATRIOTA / PPS / AVANTE / REDE / PHS
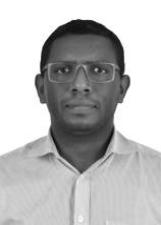
82Dr.francivando Rosa1,3450.07%
PSOL · No. 50000
Coalition: PSOL / PCB
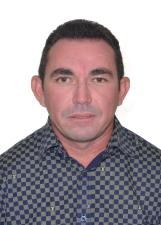
83Jânio Bina1,3250.07%
Alternate · PSDB · No. 45678
Coalition: PSDB / DEM / PSB
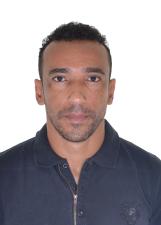
84Eduardo dos Santos1,3200.07%
Alternate · PHS · No. 31999
Coalition: PODE / PV / PRP / PATRIOTA / PPS / AVANTE / REDE / PHS

85Aluísio Rebêlo1,3080.07%
PROS · No. 90321
Coalition: PROS / PSL
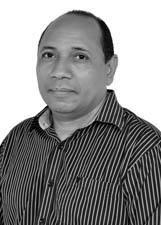
86Sargento Fernandes1,3000.07%
PSL · No. 17147
Coalition: PROS / PSL
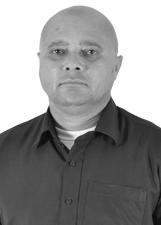
87Tenente Mário1,2580.07%
PROS · No. 90191
Coalition: PROS / PSL
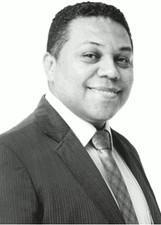
88Jk1,1880.07%
Alternate · PRP · No. 44333
Coalition: PODE / PV / PRP / PATRIOTA / PPS / AVANTE / REDE / PHS

89Allisson Aragão1,1820.07%
Alternate · SOLIDARIEDADE · No. 77777
Coalition: PMN / PRB / SOLIDARIEDADE / PPL / PTC

90Sargento Vieira1,1720.06%
Alternate · PHS · No. 31190
Coalition: PODE / PV / PRP / PATRIOTA / PPS / AVANTE / REDE / PHS
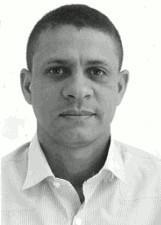
91Russo1,1390.06%
Alternate · PRP · No. 44777
Coalition: PODE / PV / PRP / PATRIOTA / PPS / AVANTE / REDE / PHS
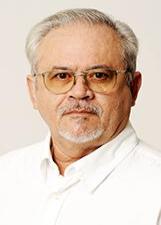
92Dr. Reinaldo1,1350.06%
Alternate · PTB · No. 14014
Coalition: PT / MDB / PP / PR / PDT / PSD / PC do B / PTB / PRTB

93Luciana Monteiro1,0880.06%
PSOL · No. 50500
Coalition: PSOL / PCB
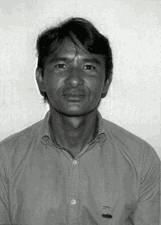
94Elizeu Veras1,0200.06%
Alternate · PRP · No. 44544
Coalition: PODE / PV / PRP / PATRIOTA / PPS / AVANTE / REDE / PHS
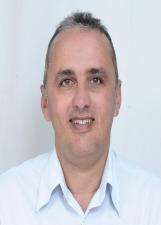
95Chico Lau1,0140.06%
DC · No. 27100

96Washington do Turismo9920.05%
Alternate · PV · No. 43000
Coalition: PODE / PV / PRP / PATRIOTA / PPS / AVANTE / REDE / PHS
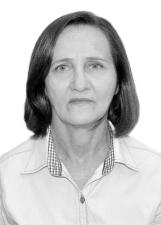
97Iolanda Rego8970.05%
Alternate · PSB · No. 40789
Coalition: PSDB / DEM / PSB

98Italo Caldas8960.05%
PROS · No. 90222
Coalition: PROS / PSL
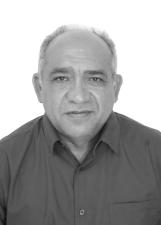
99Valdemar Machado8820.05%
Alternate · PSB · No. 40456
Coalition: PSDB / DEM / PSB
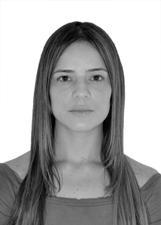
100Mikaela Guida8820.05%
PSL · No. 17177
Coalition: PROS / PSL
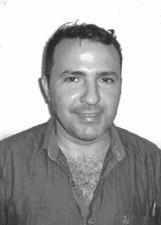
101Automelho, O Bernardo8740.05%
Alternate · PRP · No. 44555
Coalition: PODE / PV / PRP / PATRIOTA / PPS / AVANTE / REDE / PHS
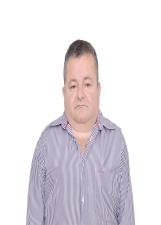
102Alexandre Almendra8600.05%
DC · No. 27222
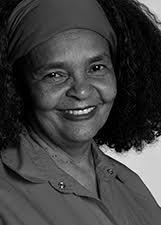
103Professora Lucia Batista8440.05%
Alternate · PT · No. 13777
Coalition: PT / MDB / PP / PR / PDT / PSD / PC do B / PTB / PRTB
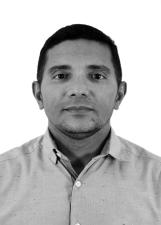
104Aldo Costa8170.04%
PROS · No. 90456
Coalition: PROS / PSL
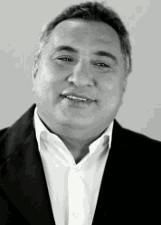
105Laécio Borges8010.04%
Alternate · PRP · No. 44444
Coalition: PODE / PV / PRP / PATRIOTA / PPS / AVANTE / REDE / PHS

106Silvio Guimarães7720.04%
Alternate · PHS · No. 31111
Coalition: PODE / PV / PRP / PATRIOTA / PPS / AVANTE / REDE / PHS
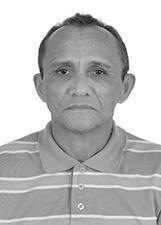
107Toinho Dufrango7640.04%
Alternate · PHS · No. 31278
Coalition: PODE / PV / PRP / PATRIOTA / PPS / AVANTE / REDE / PHS
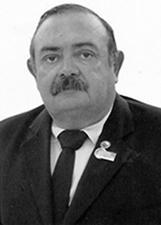
108Coronel César Lopes7640.04%
PROS · No. 90800
Coalition: PROS / PSL
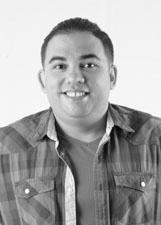
109Zé do Ovo7550.04%
Alternate · PODE · No. 19888
Coalition: PODE / PV / PRP / PATRIOTA / PPS / AVANTE / REDE / PHS
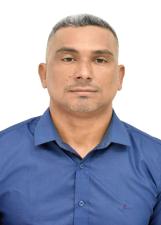
110Fransley Santos7550.04%
DC · No. 27777

111Fernanda Lobo7510.04%
Alternate · PSD · No. 55456
Coalition: PT / MDB / PP / PR / PDT / PSD / PC do B / PTB / PRTB
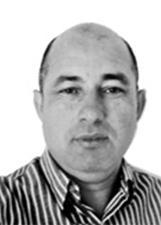
112Roberval Barros6260.03%
PROS · No. 90111
Coalition: PROS / PSL

113Poliana Barros6230.03%
PSC · No. 20123
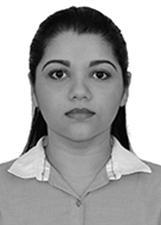
114Suyane França6110.03%
PROS · No. 90789
Coalition: PROS / PSL
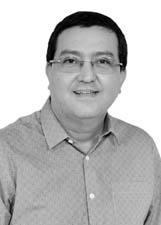
115Rocha Neto5760.03%
Alternate · SOLIDARIEDADE · No. 77456
Coalition: PMN / PRB / SOLIDARIEDADE / PPL / PTC
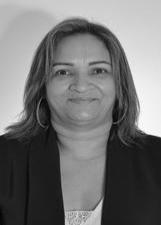
116Célia Santana5730.03%
Alternate · PV · No. 43111
Coalition: PODE / PV / PRP / PATRIOTA / PPS / AVANTE / REDE / PHS
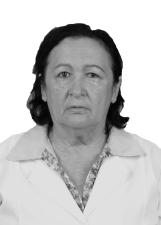
117Prof. Regina Lima5520.03%
Alternate · PMN · No. 33222
Coalition: PMN / PRB / SOLIDARIEDADE / PPL / PTC
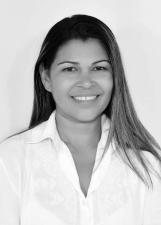
118Luziene Vogado5470.03%
Alternate · SOLIDARIEDADE · No. 77234
Coalition: PMN / PRB / SOLIDARIEDADE / PPL / PTC
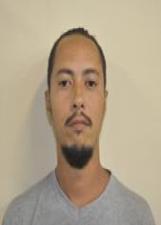
119Thiago Barroso da Silva5280.03%
PSTU · No. 16123
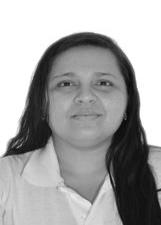
120Dra Ravenna Castro5130.03%
Alternate · PMN · No. 33333
Coalition: PMN / PRB / SOLIDARIEDADE / PPL / PTC
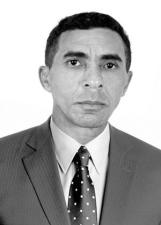
121Ferdinan do Piauí5040.03%
Alternate · PATRI · No. 51500

122Edilene Pinho5010.03%
PCB · No. 21234
Coalition: PSOL / PCB
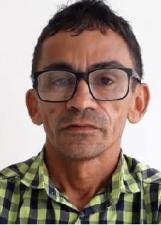
123Gleyfy Brauly4950.03%
DC · No. 27900
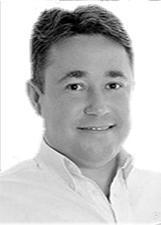
124Fabricio Aurelio4900.03%
PROS · No. 90200
Coalition: PROS / PSL
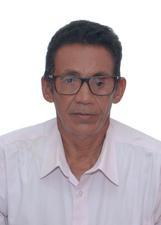
125Anisio Rocha4810.03%
PSC · No. 20000

126Mano da Lanchonete4650.03%
Alternate · PODE · No. 19222
Coalition: PODE / PV / PRP / PATRIOTA / PPS / AVANTE / REDE / PHS
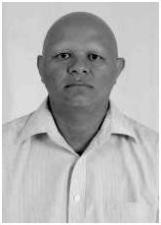
127Da Silva4600.03%
DC · No. 27114
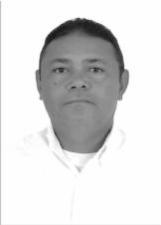
128Antonio de Jesus/dudu do Povo4510.02%
Alternate · SOLIDARIEDADE · No. 77713
Coalition: PMN / PRB / SOLIDARIEDADE / PPL / PTC

129Márem Fórttes4240.02%
PROS · No. 90011
Coalition: PROS / PSL

130Márcia Lopes4210.02%
PROS · No. 90777
Coalition: PROS / PSL
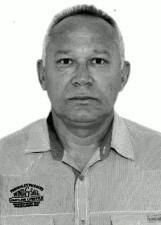
131Salomão4190.02%
Alternate · PRP · No. 44468
Coalition: PODE / PV / PRP / PATRIOTA / PPS / AVANTE / REDE / PHS

132Eufranio Benvindo3990.02%
Alternate · SOLIDARIEDADE · No. 77000
Coalition: PMN / PRB / SOLIDARIEDADE / PPL / PTC
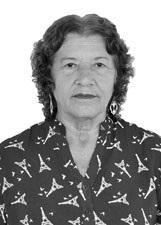
133Maria Bernadete3930.02%
Alternate · MDB · No. 15616
Coalition: PT / MDB / PP / PR / PDT / PSD / PC do B / PTB / PRTB

134Bruna Cássia3730.02%
PROS · No. 90017
Coalition: PROS / PSL
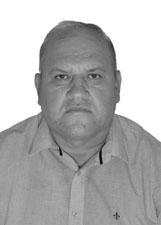
135Toninho da Soja3670.02%
PSL · No. 17456
Coalition: PROS / PSL
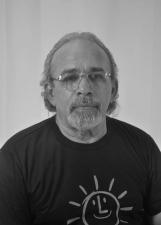
136Jaime Ferreira3570.02%
PSOL · No. 50555
Coalition: PSOL / PCB

137Sérgio Ribeiro3520.02%
Alternate · SOLIDARIEDADE · No. 77123
Coalition: PMN / PRB / SOLIDARIEDADE / PPL / PTC
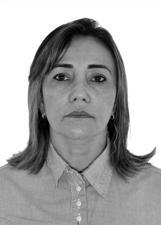
138Raquel Lima3500.02%
Alternate · PMN · No. 33123
Coalition: PMN / PRB / SOLIDARIEDADE / PPL / PTC
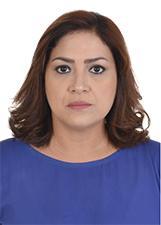
139Cantora Virna Lisi3380.02%
Alternate · PP · No. 11113
Coalition: PT / MDB / PP / PR / PDT / PSD / PC do B / PTB / PRTB
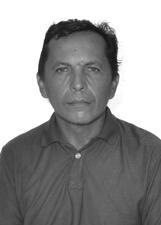
140Carlos Fábio3290.02%
PSOL · No. 50456
Coalition: PSOL / PCB
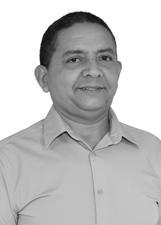
141Cleonilson Costa3230.02%
PROS · No. 90114
Coalition: PROS / PSL
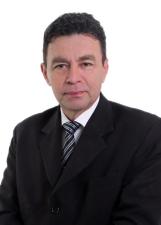
142Pastor Wilson3210.02%
Alternate · REDE · No. 18999
Coalition: PODE / PV / PRP / PATRIOTA / PPS / AVANTE / REDE / PHS
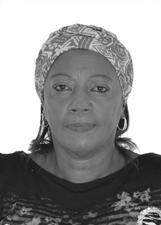
143Célia Gomes3030.02%
Alternate · PTC · No. 36118
Coalition: PMN / PRB / SOLIDARIEDADE / PPL / PTC
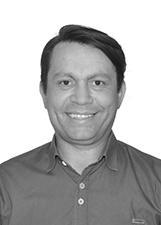
144Vai Vai Lucivan Ahhh3000.02%
Alternate · PHS · No. 31789
Coalition: PODE / PV / PRP / PATRIOTA / PPS / AVANTE / REDE / PHS

145Mônica Pita2960.02%
Alternate · PRP · No. 44666
Coalition: PODE / PV / PRP / PATRIOTA / PPS / AVANTE / REDE / PHS
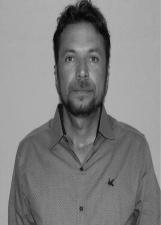
146Roberto Queiroz2930.02%
PROS · No. 90333
Coalition: PROS / PSL

147Dr. Thiago Sampaio2930.02%
Alternate · SOLIDARIEDADE · No. 77111
Coalition: PMN / PRB / SOLIDARIEDADE / PPL / PTC
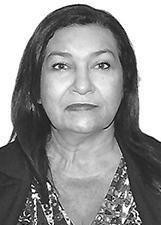
148Maria Gedalha2920.02%
PSL · No. 17555
Coalition: PROS / PSL
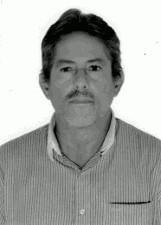
149Paulo Pedra2920.02%
Alternate · PRP · No. 44155
Coalition: PODE / PV / PRP / PATRIOTA / PPS / AVANTE / REDE / PHS
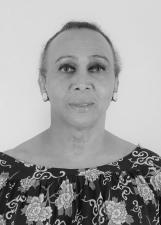
150Safira Bengell2750.02%
Alternate · PSDB · No. 45567
Coalition: PSDB / DEM / PSB
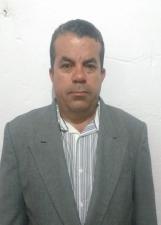
151João Batista2700.01%
Alternate · PMN · No. 33678
Coalition: PMN / PRB / SOLIDARIEDADE / PPL / PTC
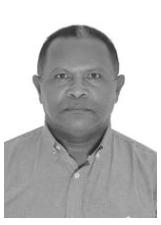
152Edivaldo Estrela2660.01%
Alternate · PMN · No. 33000
Coalition: PMN / PRB / SOLIDARIEDADE / PPL / PTC
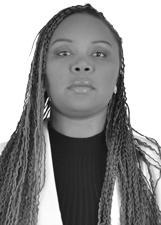
153Gracilene Santos2580.01%
PROS · No. 90990
Coalition: PROS / PSL
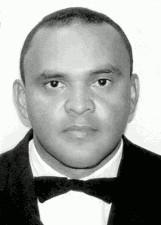
154Iran Brasil Garçom2520.01%
Alternate · PRP · No. 44999
Coalition: PODE / PV / PRP / PATRIOTA / PPS / AVANTE / REDE / PHS
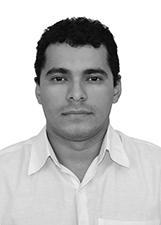
155André Galisa2470.01%
PROS · No. 90987
Coalition: PROS / PSL
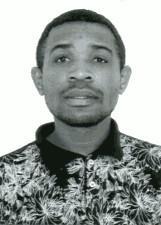
156Raimundo Silva Gari2470.01%
Alternate · PRP · No. 44177
Coalition: PODE / PV / PRP / PATRIOTA / PPS / AVANTE / REDE / PHS

157Fabia Regina2460.01%
Alternate · REDE · No. 18111
Coalition: PODE / PV / PRP / PATRIOTA / PPS / AVANTE / REDE / PHS
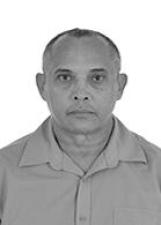
158Major Elias2410.01%
PROS · No. 90283
Coalition: PROS / PSL
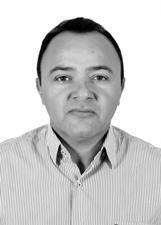
159Rony Pimentel2390.01%
Alternate · PTB · No. 14555
Coalition: PT / MDB / PP / PR / PDT / PSD / PC do B / PTB / PRTB

160Francisco da 1000tonil2220.01%
Alternate · SOLIDARIEDADE · No. 77321
Coalition: PMN / PRB / SOLIDARIEDADE / PPL / PTC

161Daniel Ribeiro2160.01%
Alternate · PODE · No. 19999
Coalition: PODE / PV / PRP / PATRIOTA / PPS / AVANTE / REDE / PHS
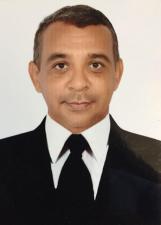
162Prof Marcilio Nauber2100.01%
Alternate · PATRI · No. 51111
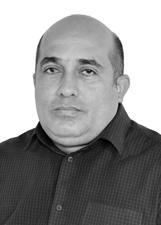
163Alex Melo2000.01%
Alternate · REDE · No. 18123
Coalition: PODE / PV / PRP / PATRIOTA / PPS / AVANTE / REDE / PHS

164Pastor Rynaldo Careca1940.01%
Alternate · PRTB · No. 28000
Coalition: PT / MDB / PP / PR / PDT / PSD / PC do B / PTB / PRTB
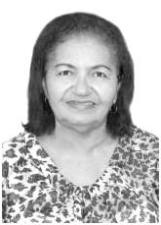
165Professora Ana Luiza1820.01%
DC · No. 27029
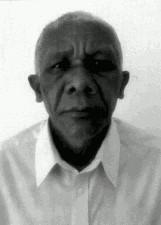
166Tempero173<0.01%
Alternate · PRP · No. 44456
Coalition: PODE / PV / PRP / PATRIOTA / PPS / AVANTE / REDE / PHS
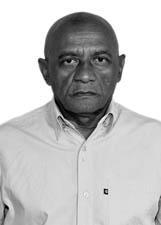
167Coronel Moreira172<0.01%
PROS · No. 90000
Coalition: PROS / PSL
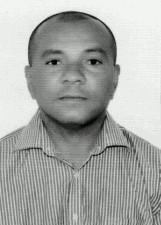
168Marcospretobantu172<0.01%
Alternate · PRP · No. 44566
Coalition: PODE / PV / PRP / PATRIOTA / PPS / AVANTE / REDE / PHS
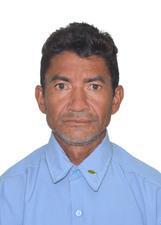
169Raimundo Paquetá160<0.01%
PSC · No. 20001
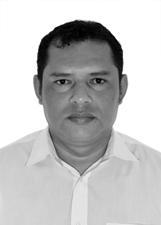
170Professor Lima153<0.01%
Alternate · SOLIDARIEDADE · No. 77789
Coalition: PMN / PRB / SOLIDARIEDADE / PPL / PTC
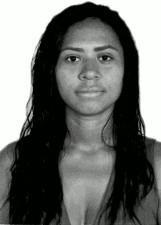
171Alessandra Kellen144<0.01%
Alternate · PRP · No. 44258
Coalition: PODE / PV / PRP / PATRIOTA / PPS / AVANTE / REDE / PHS
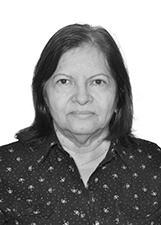
172Professora Nelsa137<0.01%
Alternate · PTC · No. 36987
Coalition: PMN / PRB / SOLIDARIEDADE / PPL / PTC
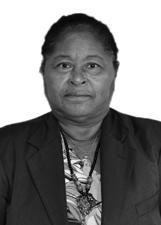
173Trindade Ribeiro136<0.01%
Alternate · PSDB · No. 45145
Coalition: PSDB / DEM / PSB
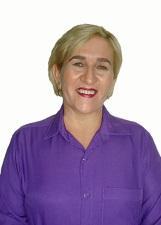
174Luiza Holanda128<0.01%
Alternate · MDB · No. 15456
Coalition: PT / MDB / PP / PR / PDT / PSD / PC do B / PTB / PRTB

175Ana Tarla124<0.01%
Alternate · PHS · No. 31888
Coalition: PODE / PV / PRP / PATRIOTA / PPS / AVANTE / REDE / PHS

176Maria Izaiane117<0.01%
DC · No. 27300
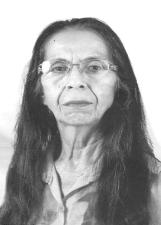
177Elizabete115<0.01%
Alternate · PV · No. 43521
Coalition: PODE / PV / PRP / PATRIOTA / PPS / AVANTE / REDE / PHS
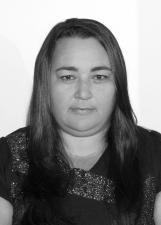
178Missionária Marconiza98<0.01%
Alternate · PHS · No. 31222
Coalition: PODE / PV / PRP / PATRIOTA / PPS / AVANTE / REDE / PHS

179Rejane Moreno97<0.01%
Alternate · PRP · No. 44044
Coalition: PODE / PV / PRP / PATRIOTA / PPS / AVANTE / REDE / PHS
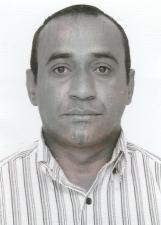
180Odair Jose95<0.01%
DC · No. 27600
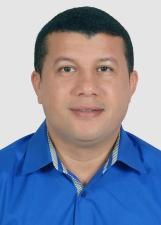
181Zé Neto94<0.01%
Alternate · PSB · No. 40765
Coalition: PSDB / DEM / PSB
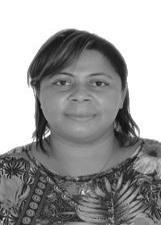
182Cleia Barroso93<0.01%
Alternate · PMN · No. 33456
Coalition: PMN / PRB / SOLIDARIEDADE / PPL / PTC
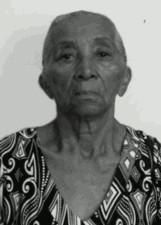
183Caetana90<0.01%
Alternate · PRP · No. 44321
Coalition: PODE / PV / PRP / PATRIOTA / PPS / AVANTE / REDE / PHS
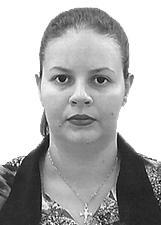
184Lili Santiago87<0.01%
PROS · No. 90555
Coalition: PROS / PSL

185Milena Cardoso87<0.01%
DC · No. 27000
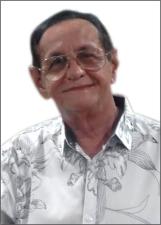
186Prof. Soares86<0.01%
Alternate · PODE · No. 19789
Coalition: PODE / PV / PRP / PATRIOTA / PPS / AVANTE / REDE / PHS
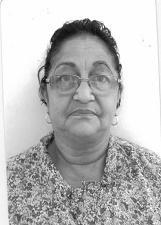
187Maria de Fátima85<0.01%
Alternate · MDB · No. 15258
Coalition: PT / MDB / PP / PR / PDT / PSD / PC do B / PTB / PRTB

188Amanda Karolliny78<0.01%
Alternate · PRP · No. 44577
Coalition: PODE / PV / PRP / PATRIOTA / PPS / AVANTE / REDE / PHS
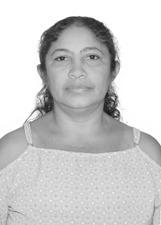
189Desterro Silva67<0.01%
Alternate · PATRI · No. 51117
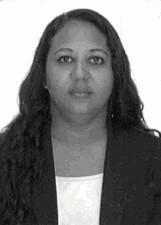
190Cileia62<0.01%
Alternate · PRP · No. 44344
Coalition: PODE / PV / PRP / PATRIOTA / PPS / AVANTE / REDE / PHS
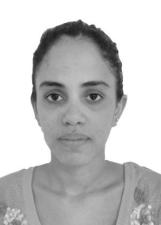
191Bolivia60<0.01%
PCO · No. 29029

192Marciana Silveira54<0.01%
PROS · No. 90888
Coalition: PROS / PSL
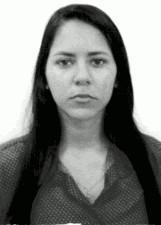
193Angela54<0.01%
Alternate · PRP · No. 44322
Coalition: PODE / PV / PRP / PATRIOTA / PPS / AVANTE / REDE / PHS
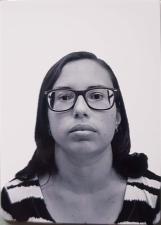
194Livinha42<0.01%
Alternate · PC do B · No. 65444
Coalition: PT / MDB / PP / PR / PDT / PSD / PC do B / PTB / PRTB
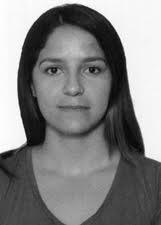
195Tamires Vasconcelos41<0.01%
Alternate · PR · No. 22555
Coalition: PT / MDB / PP / PR / PDT / PSD / PC do B / PTB / PRTB
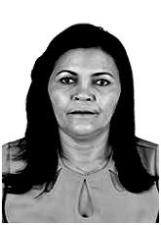
196Graça Santos38<0.01%
DC · No. 27033
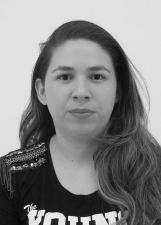
197Anderkelly Gomes30<0.01%
Alternate · PHS · No. 31258
Coalition: PODE / PV / PRP / PATRIOTA / PPS / AVANTE / REDE / PHS

198Francisca Helena30<0.01%
DC · No. 27123
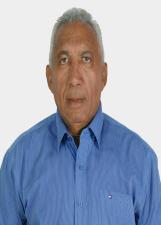
199Roberval Jose29<0.01%
DC · No. 27007
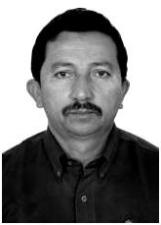
200Waldemar Macedo24<0.01%
DC · No. 27190
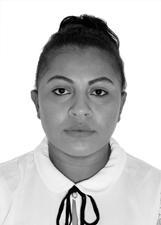
201Lidiane Monteiro9<0.01%
Alternate · PTC · No. 36456
Coalition: PMN / PRB / SOLIDARIEDADE / PPL / PTC
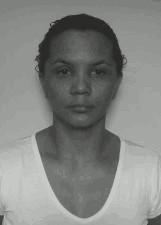
202Janaina8<0.01%
Alternate · PRP · No. 44543
Coalition: PODE / PV / PRP / PATRIOTA / PPS / AVANTE / REDE / PHS
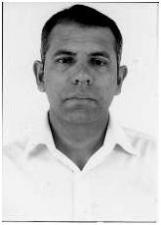
203Cristiomar Cvj6<0.01%
DC · No. 27444
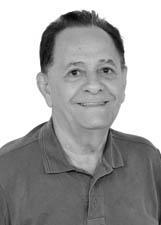
—Eurimar Nunes2,925
Annulled votesRejected · PSB · No. 40112
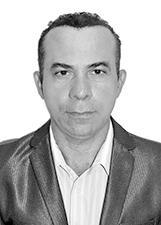
—Prof. Ezequiel (zé Filho)584
Annulled votesRejected · PSL · No. 17000
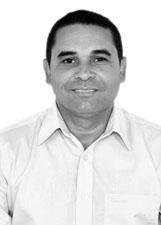
—Fábio Castro478
Annulled votesRejected · PPL · No. 54000

—Sara Mendes411
Annulled votesRejected · REDE · No. 18888
—Ronaldo Soares43
Annulled votesRejected · PCO · No. 29129


