In 2010, in Piauí, 30 state deputies were elected, according to data from Brazil's Superior Electoral Court (TSE). The largest caucuses were those of PT, PSB and PMDB, with 5 each. The most votes went to Lilian Martins (PSB), with 66,529 votes (3.89% of the valid votes). The electoral quotient was about 56,959 votes, and the lowest vote total among those elected was 10,900: seats are allocated to the party first.
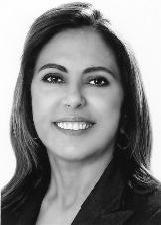
1Lilian Martins66,5293.89%
Elected · PSB · No. 40123
Coalition: PC do B / PMDB / PR / PRB / PRP / PSB / PTN
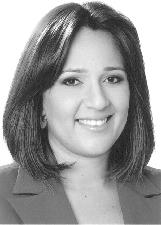
2Rejane Dias55,1773.23%
Elected · PT · No. 13654
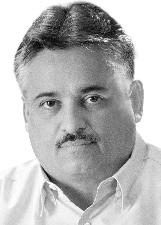
3Robert Rios52,7993.09%
Elected · PC do B · No. 65123
Coalition: PC do B / PMDB / PR / PRB / PRP / PSB / PTN
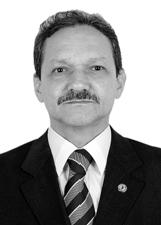
4Wilson Brandão48,6362.85%
Elected · PSB · No. 40111
Coalition: PC do B / PMDB / PR / PRB / PRP / PSB / PTN

5Firmino47,6342.79%
Elected · PSDB · No. 45145
Coalition: DEM / PPS / PSC / PSDB
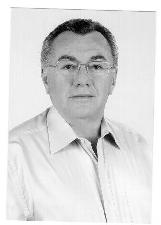
6Kleber Eulalio47,4742.78%
Elected · PMDB · No. 15101
Coalition: PC do B / PMDB / PR / PRB / PRP / PSB / PTN
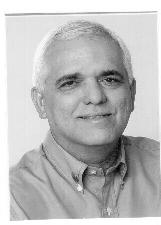
7Themistocles Filho46,3202.71%
Elected · PMDB · No. 15111
Coalition: PC do B / PMDB / PR / PRB / PRP / PSB / PTN
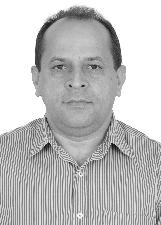
8Hélio Isaias42,2312.47%
Elected · PTB · No. 14454
Coalition: PRTB / PTB
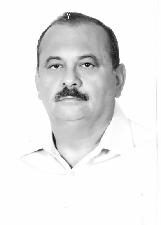
9Fernando Monteiro41,9372.45%
Elected · PTB · No. 14114
Coalition: PRTB / PTB
10Luciano Nunes37,8602.22%
Elected · PSDB · No. 45123
Coalition: DEM / PPS / PSC / PSDB
11Marden Menezes35,6442.09%
Elected · PSDB · No. 45555
Coalition: DEM / PPS / PSC / PSDB

12Gustavo Neiva35,0322.05%
Elected · PSB · No. 40555
Coalition: PC do B / PMDB / PR / PRB / PRP / PSB / PTN

13Ana Paula34,3852.01%
Elected · PMDB · No. 15110
Coalition: PC do B / PMDB / PR / PRB / PRP / PSB / PTN
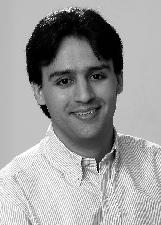
14Flávio Nogueira32,9561.93%
Elected · PDT · No. 12369
Coalition: PDT / PP
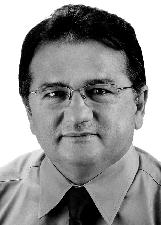
15Merlong Solano31,3511.83%
Elected · PT · No. 13131
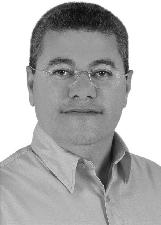
16Edson Ferreira29,8191.75%
Elected · DEM · No. 25132
Coalition: DEM / PPS / PSC / PSDB
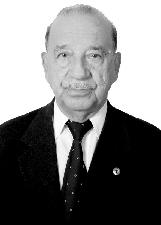
17Juraci Leite28,8771.69%
Elected · DEM · No. 25123
Coalition: DEM / PPS / PSC / PSDB
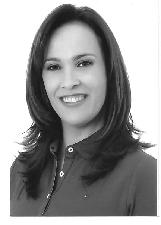
18Juliana Moraes Souza28,6341.68%
Elected · PMDB · No. 15130
Coalition: PC do B / PMDB / PR / PRB / PRP / PSB / PTN
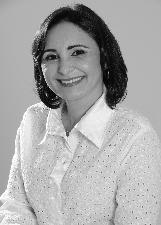
19Liziê Coelho28,0491.64%
Elected · PTB · No. 14789
Coalition: PRTB / PTB
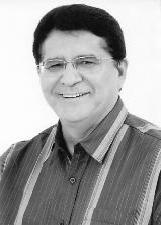
20Ismar26,6651.56%
Elected · PSB · No. 40000
Coalition: PC do B / PMDB / PR / PRB / PRP / PSB / PTN
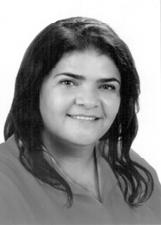
21Belê24,7361.45%
Elected · PSB · No. 40140
Coalition: PC do B / PMDB / PR / PRB / PRP / PSB / PTN
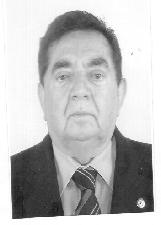
22Warton Santos24,5261.44%
Elected (remainder seat) · PMDB · No. 15199
Coalition: PC do B / PMDB / PR / PRB / PRP / PSB / PTN
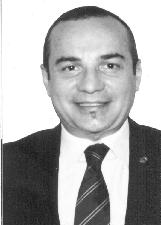
23Henrique Rebelo24,4051.43%
Elected · PT · No. 13147
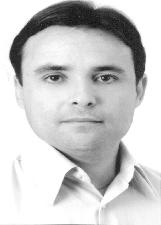
24Fabio NOVO24,0221.41%
Elected · PT · No. 13111

25Antônio Félix23,7501.39%
Elected (remainder seat) · PPS · No. 23123
Coalition: DEM / PPS / PSC / PSDB
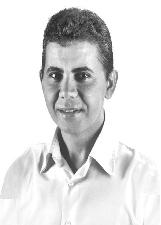
26Paulo Martins23,1121.35%
Elected · PT · No. 13252

27João Mádison22,8201.34%
Alternate · PMDB · No. 15555
Coalition: PC do B / PMDB / PR / PRB / PRP / PSB / PTN
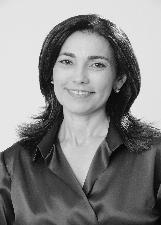
28Margarete Coelho22,7491.33%
Elected · PP · No. 11111
Coalition: PDT / PP

29Nerinho22,4911.32%
Elected (remainder seat) · PTB · No. 14000
Coalition: PRTB / PTB
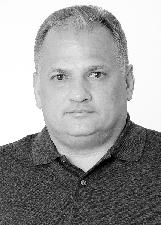
30Mauro Tapety21,8101.28%
Alternate · PMDB · No. 15112
Coalition: PC do B / PMDB / PR / PRB / PRP / PSB / PTN
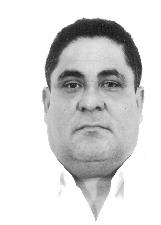
31Magalhaes21,4291.25%
Alternate · PT · No. 13567
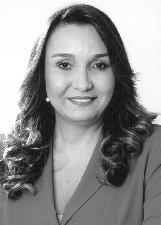
32Flora Izabel20,9331.23%
Alternate · PT · No. 13678
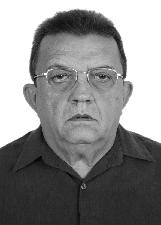
33Ubiraci Carvalho20,8141.22%
Elected · PDT · No. 12312
Coalition: PDT / PP
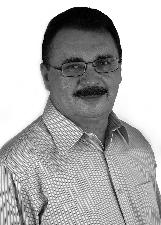
34Uchoa20,2131.18%
Alternate · PDT · No. 12222
Coalition: PDT / PP
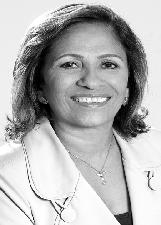
35Amparo Landim20,0131.17%
Alternate · DEM · No. 25111
Coalition: DEM / PPS / PSC / PSDB
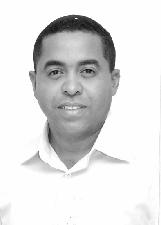
36Joilson Rodrigues19,9471.17%
Alternate · PTB · No. 14660
Coalition: PRTB / PTB
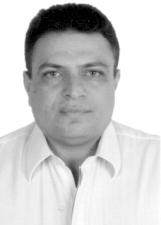
37Pastor Gessivaldo17,7771.04%
Alternate · PRB · No. 10123
Coalition: PC do B / PMDB / PR / PRB / PRP / PSB / PTN
38Roncalli Paulo16,8470.99%
Alternate · PSDB · No. 45131
Coalition: DEM / PPS / PSC / PSDB
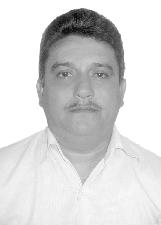
39Joninha16,1700.95%
Alternate · PSDB · No. 45615
Coalition: DEM / PPS / PSC / PSDB
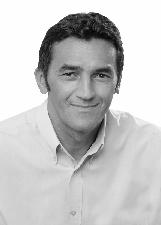
40Tererê16,0060.94%
Alternate · PSDB · No. 45111
Coalition: DEM / PPS / PSC / PSDB
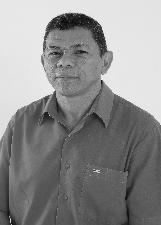
41Joao de Deus15,6220.91%
Alternate · PT · No. 13222
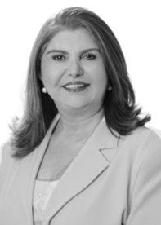
42Professora Elza Bucar14,8800.87%
Alternate · PDT · No. 12345
Coalition: PDT / PP
43Irmão Elias14,6070.85%
Alternate · PSDB · No. 45678
Coalition: DEM / PPS / PSC / PSDB
44Tadeu Maia13,7690.81%
Alternate · PSB · No. 40345
Coalition: PC do B / PMDB / PR / PRB / PRP / PSB / PTN
45Valério Carvalho11,8750.69%
Alternate · PDT · No. 12555
Coalition: PDT / PP
46Evaldo Gomes10,9000.64%
Elected · PTC · No. 36789
Coalition: PHS / PT do B / PTC
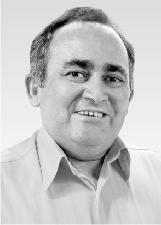
47Guedes10,6960.63%
Alternate · PT · No. 13456
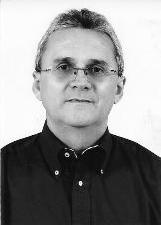
48Odival Andrade10,6070.62%
Alternate · PSB · No. 40789
Coalition: PC do B / PMDB / PR / PRB / PRP / PSB / PTN
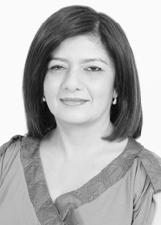
49Nize Rego10,5490.62%
Alternate · PSB · No. 40333
Coalition: PC do B / PMDB / PR / PRB / PRP / PSB / PTN
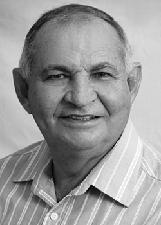
50Dr. Pinto10,4780.61%
Alternate · PDT · No. 12456
Coalition: PDT / PP
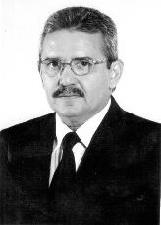
51Coronel Edvaldo Marques10,0980.59%
Alternate · PSB · No. 40190
Coalition: PC do B / PMDB / PR / PRB / PRP / PSB / PTN
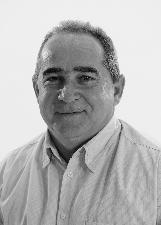
52Paulo César Vilarinho9,5750.56%
Alternate · PTB · No. 14123
Coalition: PRTB / PTB
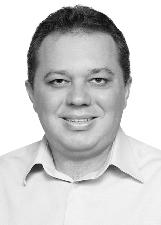
53Florentino Neto9,2190.54%
Alternate · PT · No. 13613
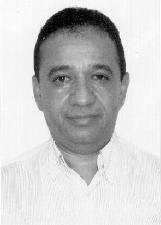
54Dr. Hélio8,5170.50%
Alternate · PT do B · No. 70369
Coalition: PHS / PT do B / PTC
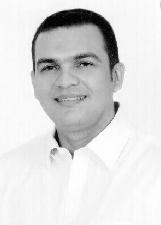
55Vinicio Ferreira7,6530.45%
Alternate · PT do B · No. 70852
Coalition: PHS / PT do B / PTC

56Jorge Lopes6,2910.37%
Alternate · PTB · No. 14444
Coalition: PRTB / PTB
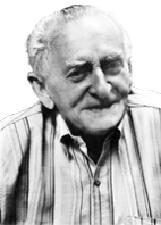
57Elias Prado5,9990.35%
Alternate · PT do B · No. 70123
Coalition: PHS / PT do B / PTC

58Evandro Luz5,7290.34%
Alternate · PT · No. 13123
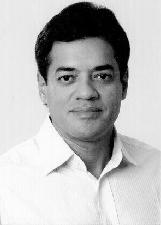
59Dr. Fonseca Junior5,4780.32%
Alternate · PTC · No. 36987
Coalition: PHS / PT do B / PTC
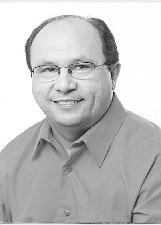
60Dr. Eucário5,3890.32%
Alternate · PT · No. 13789
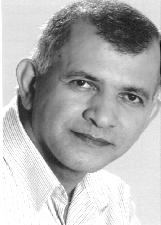
61Marcelino Fonteles5,3040.31%
Alternate · PT · No. 13444
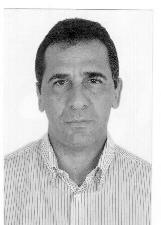
62Gilberto Junior5,0910.30%
Alternate · PMDB · No. 15000
Coalition: PC do B / PMDB / PR / PRB / PRP / PSB / PTN
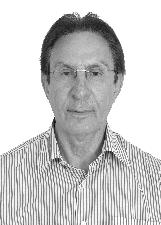
63Jonatas4,0930.24%
Alternate · PTB · No. 14222
Coalition: PRTB / PTB
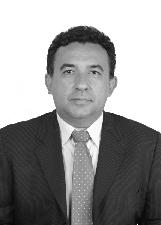
64Vicente Orlando3,8130.22%
Alternate · PTB · No. 14333
Coalition: PRTB / PTB
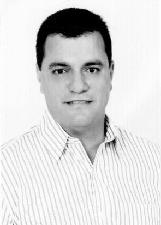
65Joaquim do Arroz3,6350.21%
Alternate · PT do B · No. 70555
Coalition: PHS / PT do B / PTC
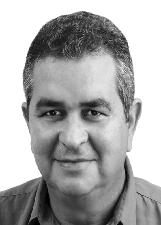
66Isaías Rocha3,5000.20%
Alternate · PSDB · No. 45456
Coalition: DEM / PPS / PSC / PSDB
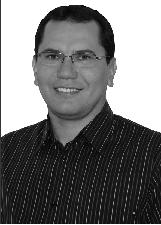
67Lauro César3,4480.20%
Alternate · PDT · No. 12580
Coalition: PDT / PP
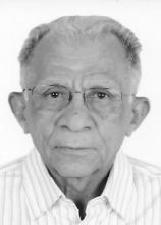
68Dr. Chico Ramos2,4610.14%
Alternate · PSB · No. 40222
Coalition: PC do B / PMDB / PR / PRB / PRP / PSB / PTN
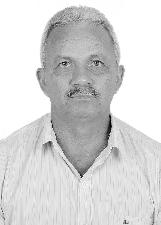
69Nizomar Barros2,3920.14%
PV · No. 43123
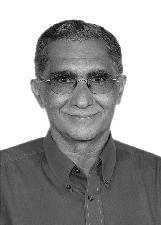
70Padre Ladislau2,3590.14%
Alternate · PT · No. 13000
71Raulino2,2800.13%
Alternate · PSDB · No. 45045
Coalition: DEM / PPS / PSC / PSDB
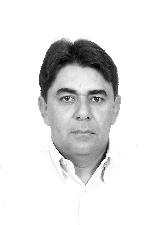
72Candinho2,2060.13%
Alternate · PDT · No. 12612
Coalition: PDT / PP
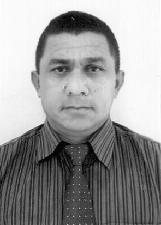
73Raimundo Lima2,0130.12%
Alternate · PT do B · No. 70789
Coalition: PHS / PT do B / PTC
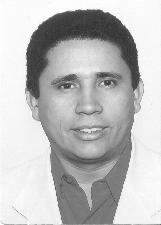
74Raimundo Martins1,9920.12%
Alternate · PT · No. 13333
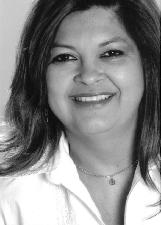
75Zenaide Lustosa1,8260.11%
Alternate · PT · No. 13013
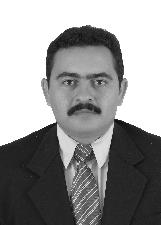
76Irmão Jonas Vieira1,7900.10%
Alternate · PSC · No. 20000
Coalition: DEM / PPS / PSC / PSDB
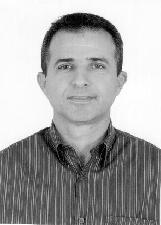
77Pedro Borges1,6320.10%
Alternate · PT do B · No. 70345
Coalition: PHS / PT do B / PTC
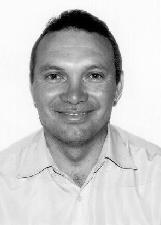
78Isaias Araujo1,5550.09%
Alternate · PTC · No. 36222
Coalition: PHS / PT do B / PTC
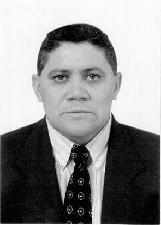
79Siriano1,3230.08%
Alternate · PTC · No. 36777
Coalition: PHS / PT do B / PTC
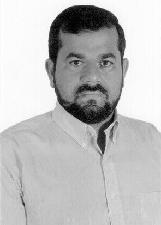
80Frederico Rebelo1,2750.07%
Alternate · PTC · No. 36999
Coalition: PHS / PT do B / PTC
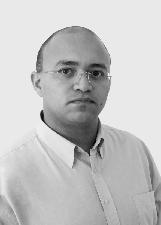
81Joaquim Júnior1,2650.07%
Alternate · PSDB · No. 45666
Coalition: DEM / PPS / PSC / PSDB
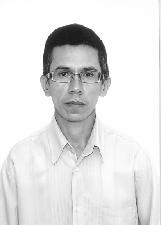
82Pr. Chagas Araújo1,2580.07%
Alternate · PTB · No. 14200
Coalition: PRTB / PTB
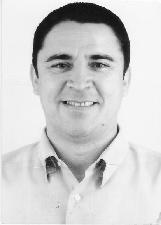
83Hands Wellington1,1760.07%
PV · No. 43456
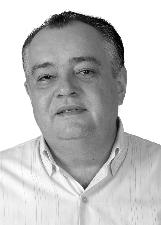
84Anisio Neves1,1190.07%
Alternate · DEM · No. 25456
Coalition: DEM / PPS / PSC / PSDB
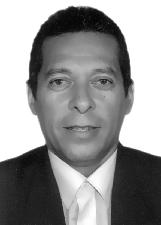
85Marquinhos1,0970.06%
Alternate · PTB · No. 14144
Coalition: PRTB / PTB
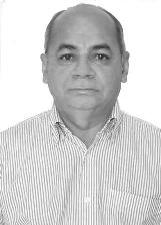
86Clemilton Viana1,0220.06%
Alternate · PTN · No. 19999
Coalition: PC do B / PMDB / PR / PRB / PRP / PSB / PTN
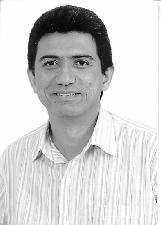
87Caio Lustosa Bucar9720.06%
Alternate · PTB · No. 14111
Coalition: PRTB / PTB
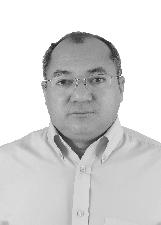
88Dr. Gilson Osorio9410.06%
Alternate · PDT · No. 12192
Coalition: PDT / PP
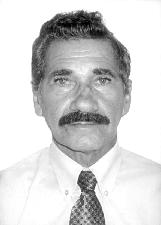
89Feitosa9340.05%
Alternate · DEM · No. 25252
Coalition: DEM / PPS / PSC / PSDB
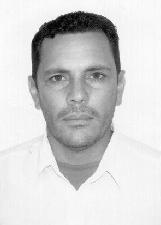
90Luizinho9280.05%
Alternate · PT do B · No. 70111
Coalition: PHS / PT do B / PTC
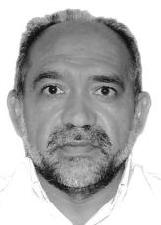
91Valdemar Machado8720.05%
Alternate · PSB · No. 40456
Coalition: PC do B / PMDB / PR / PRB / PRP / PSB / PTN
92Dr Marcus Sabry/dr Sabry8640.05%
Alternate · PSDB · No. 45567
Coalition: DEM / PPS / PSC / PSDB
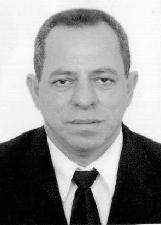
93Nerval Junior8590.05%
Alternate · PT do B · No. 70963
Coalition: PHS / PT do B / PTC

94José Luiz de Carvalho8210.05%
Alternate · PHS · No. 31111
Coalition: PHS / PT do B / PTC
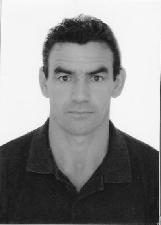
95Ronaldo Chaves7590.04%
PV · No. 43666
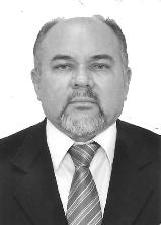
96Vasco6740.04%
Alternate · PRP · No. 44000
Coalition: PC do B / PMDB / PR / PRB / PRP / PSB / PTN
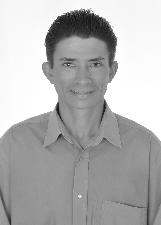
97Cleves Alencar6440.04%
Alternate · PT · No. 13150
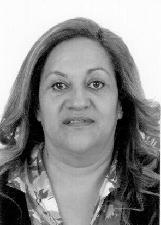
98Lisete Napoleão6410.04%
Alternate · PHS · No. 31031
Coalition: PHS / PT do B / PTC

99Joaquim Santana Neto5900.03%
Alternate · DEM · No. 25321
Coalition: DEM / PPS / PSC / PSDB
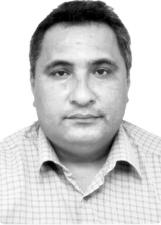
100Laécio Borges5610.03%
Alternate · PRP · No. 44444
Coalition: PC do B / PMDB / PR / PRB / PRP / PSB / PTN
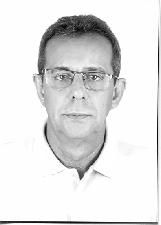
101Mapurunga5550.03%
Alternate · PTB · No. 14007
Coalition: PRTB / PTB
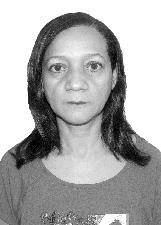
102Solimar Silva5180.03%
PSTU · No. 16567
103Renato Sátiro5080.03%
PV · No. 43000
104Bartozim4740.03%
Alternate · PRP · No. 44555
Coalition: PC do B / PMDB / PR / PRB / PRP / PSB / PTN
105Voluntário de Vidas4390.03%
Alternate · PSDB · No. 45192
Coalition: DEM / PPS / PSC / PSDB
106Irmã Fatima4240.02%
Alternate · PT · No. 13300
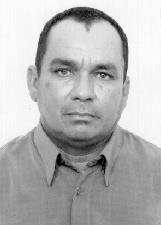
107Valdecy Xisto4160.02%
Alternate · PTC · No. 36345
Coalition: PHS / PT do B / PTC
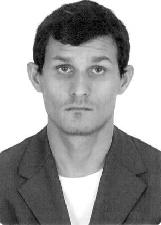
108Dr. Leonardo4120.02%
Alternate · PT do B · No. 70258
Coalition: PHS / PT do B / PTC
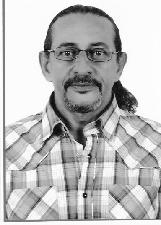
109Alexis4000.02%
PSOL · No. 50111
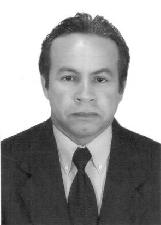
110Pedro Quaresma3780.02%
Alternate · PTC · No. 36444
Coalition: PHS / PT do B / PTC
111Minas de França3760.02%
PSOL · No. 50222
112Fred Melo3760.02%
Alternate · PP · No. 11222
Coalition: PDT / PP
113Rogerio Carcará3750.02%
Alternate · PTC · No. 36666
Coalition: PHS / PT do B / PTC
114Angélica3450.02%
PSL · No. 17177
115Lourival Moura3280.02%
Alternate · PR · No. 22222
Coalition: PC do B / PMDB / PR / PRB / PRP / PSB / PTN
116Alice Lopes3230.02%
PV · No. 43143
117Toinho Nemésio3140.02%
Alternate · PTN · No. 19333
Coalition: PC do B / PMDB / PR / PRB / PRP / PSB / PTN
118Rychewlly3050.02%
PSOL · No. 50000
119Aldamir2750.02%
PMN · No. 33107
120Roberval Barros2610.02%
Alternate · PTC · No. 36780
Coalition: PHS / PT do B / PTC
121Graciosa2590.02%
Alternate · PTB · No. 14281
Coalition: PRTB / PTB
122Carlos Medeiro2540.01%
Alternate · PT do B · No. 70147
Coalition: PHS / PT do B / PTC
123Saraiva2460.01%
Alternate · PMDB · No. 15147
Coalition: PC do B / PMDB / PR / PRB / PRP / PSB / PTN
124Raimundo Paqueta2390.01%
Alternate · PMDB · No. 15999
Coalition: PC do B / PMDB / PR / PRB / PRP / PSB / PTN
125Vera Lúcia2280.01%
Alternate · PSDB · No. 45245
Coalition: DEM / PPS / PSC / PSDB
126Cirilo2130.01%
Alternate · PT do B · No. 70112
Coalition: PHS / PT do B / PTC
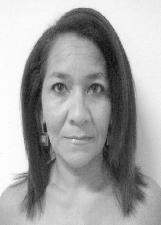
127Dona Deusa2070.01%
Alternate · PT · No. 13234
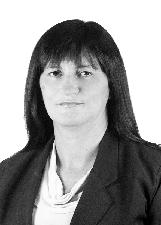
128Antonia Maria2050.01%
PV · No. 43222
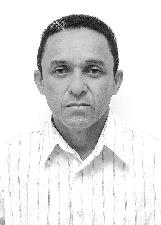
129Carlos Alberto2040.01%
Alternate · DEM · No. 25654
Coalition: DEM / PPS / PSC / PSDB
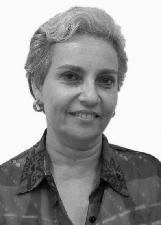
130Josevita Tapety1900.01%
PV · No. 43333
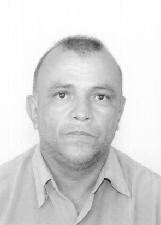
131José Ribamar1850.01%
Alternate · PHS · No. 31456
Coalition: PHS / PT do B / PTC
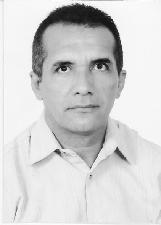
132Francisco Araújo1710.01%
PV · No. 43555
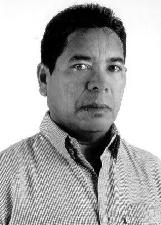
133Zebra Neles170<0.01%
Alternate · PTC · No. 36123
Coalition: PHS / PT do B / PTC
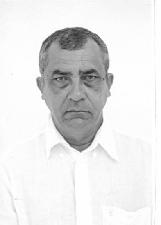
134Sgt.quaresma159<0.01%
Alternate · PTB · No. 14147
Coalition: PRTB / PTB
135Ana Veras156<0.01%
PSOL · No. 50567

136Jp Costa156<0.01%
Alternate · PRTB · No. 28888
Coalition: PRTB / PTB
137Josafa Miranda155<0.01%
PV · No. 43111
138Carla Ramos154<0.01%
Alternate · PT do B · No. 70370
Coalition: PHS / PT do B / PTC
139Mario Braga154<0.01%
Alternate · PDT · No. 12582
Coalition: PDT / PP
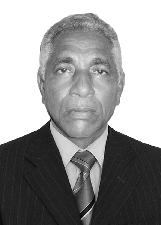
140Gerardo149<0.01%
Alternate · DEM · No. 25112
Coalition: DEM / PPS / PSC / PSDB
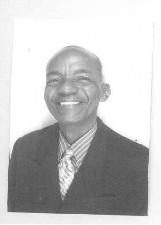
141Zezinho Barros148<0.01%
Alternate · PP · No. 11333
Coalition: PDT / PP
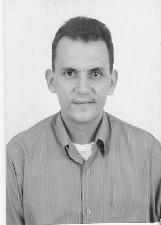
142Professor Filintro Neto147<0.01%
PV · No. 43457
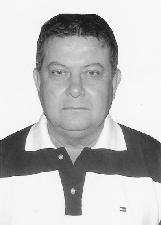
143Valdemar Rodrigues147<0.01%
PV · No. 43606
144Bento Alves145<0.01%
Alternate · PDT · No. 12000
Coalition: PDT / PP
145Dr. Menandro143<0.01%
Alternate · PSDB · No. 45112
Coalition: DEM / PPS / PSC / PSDB
146Miriam Mota143<0.01%
Alternate · PPS · No. 23000
Coalition: DEM / PPS / PSC / PSDB
147Gabi140<0.01%
Alternate · PT do B · No. 70700
Coalition: PHS / PT do B / PTC
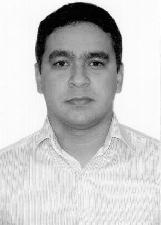
148Pablo Costa127<0.01%
Alternate · PTC · No. 36555
Coalition: PHS / PT do B / PTC
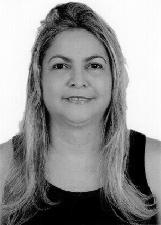
149Luciêne Sampaio123<0.01%
Alternate · PT do B · No. 70270
Coalition: PHS / PT do B / PTC
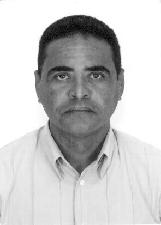
150Sales111<0.01%
Alternate · PT do B · No. 70170
Coalition: PHS / PT do B / PTC
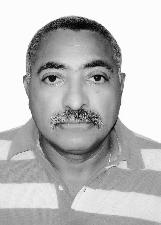
151Jose Vicente105<0.01%
PV · No. 43110
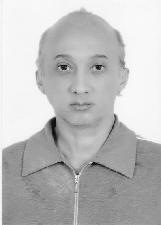
152Hugo Prado104<0.01%
PV · No. 43678
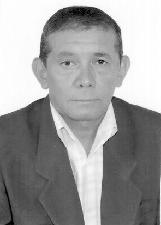
153Carlos Alberto Nenen99<0.01%
Alternate · PHS · No. 31123
Coalition: PHS / PT do B / PTC
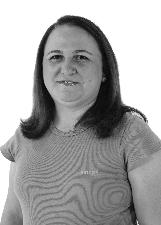
154Rejane Sampaio95<0.01%
Alternate · PTB · No. 14500
Coalition: PRTB / PTB
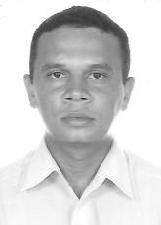
155Cleidomir Junior87<0.01%
Alternate · PTN · No. 19190
Coalition: PC do B / PMDB / PR / PRB / PRP / PSB / PTN
156Hélio Moraes84<0.01%
Alternate · DEM · No. 25147
Coalition: DEM / PPS / PSC / PSDB
157Chico Neto68<0.01%
Alternate · DEM · No. 25369
Coalition: DEM / PPS / PSC / PSDB
158Márcio Armon66<0.01%
Alternate · PP · No. 11000
Coalition: PDT / PP
159Cabo Vitor46<0.01%
PV · No. 43323
160Prof. Gilson40<0.01%
Alternate · PRB · No. 10789
Coalition: PC do B / PMDB / PR / PRB / PRP / PSB / PTN
161Virginia Brandão31<0.01%
Alternate · PSDB · No. 45120
Coalition: DEM / PPS / PSC / PSDB
162Mércia Paulo31<0.01%
Alternate · PSDB · No. 45789
Coalition: DEM / PPS / PSC / PSDB
163Patrícia30<0.01%
Alternate · PC do B · No. 65198
Coalition: PC do B / PMDB / PR / PRB / PRP / PSB / PTN
164Angelica Coelho30<0.01%
Alternate · PSB · No. 40451
Coalition: PC do B / PMDB / PR / PRB / PRP / PSB / PTN
165Dr.ursulino19<0.01%
Alternate · PRTB · No. 28111
Coalition: PRTB / PTB
166Julianna Leal19<0.01%
Alternate · PTB · No. 14134
Coalition: PRTB / PTB
167Manoel Simplício10<0.01%
PV · No. 43567
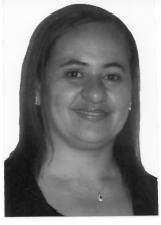
168Francinete Maia10<0.01%
Alternate · PRB · No. 10133
Coalition: PC do B / PMDB / PR / PRB / PRP / PSB / PTN
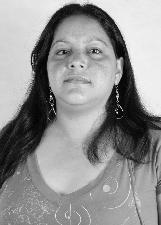
169Joyce Samara8<0.01%
Alternate · PC do B · No. 65187
Coalition: PC do B / PMDB / PR / PRB / PRP / PSB / PTN
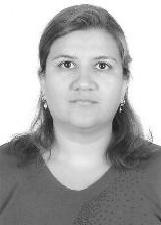
170Edilene Sousa4<0.01%
Alternate · PRB · No. 10144
Coalition: PC do B / PMDB / PR / PRB / PRP / PSB / PTN
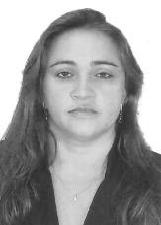
171Lourdinha4<0.01%
Alternate · PTN · No. 19000
Coalition: PC do B / PMDB / PR / PRB / PRP / PSB / PTN
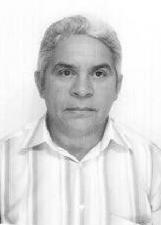
172Chico Costa3<0.01%
Alternate · PT do B · No. 70145
Coalition: PHS / PT do B / PTC
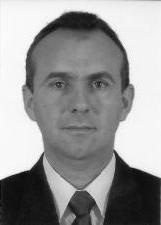
173Marcio Kyldare3<0.01%
Alternate · PRB · No. 10456
Coalition: PC do B / PMDB / PR / PRB / PRP / PSB / PTN
174João Sabino Paulo3<0.01%
Alternate · PSDB · No. 45888
Coalition: DEM / PPS / PSC / PSDB

175Ivo Leite2<0.01%
Alternate · PRTB · No. 28222
Coalition: PRTB / PTB
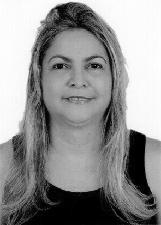
176Rosângela Brito1<0.01%
Alternate · PTC · No. 36001
Coalition: PHS / PT do B / PTC
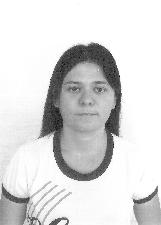
177Vallice Aguiar1<0.01%
Alternate · PSC · No. 20220
Coalition: DEM / PPS / PSC / PSDB
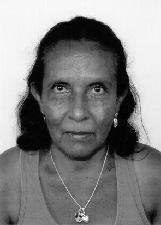
178Maria Aucirene1<0.01%
Alternate · PTC · No. 36005
Coalition: PHS / PT do B / PTC
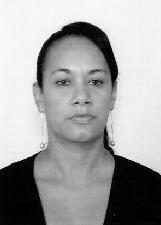
179Vilma Gomes1<0.01%
Alternate · PTC · No. 36007
Coalition: PHS / PT do B / PTC
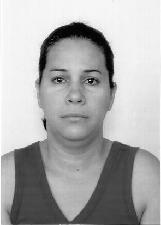
180Maisa1<0.01%
Alternate · PTC · No. 36006
Coalition: PHS / PT do B / PTC
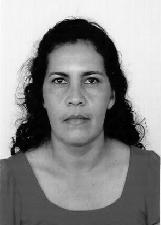
181Neusa Araujo1<0.01%
Alternate · PTC · No. 36004
Coalition: PHS / PT do B / PTC
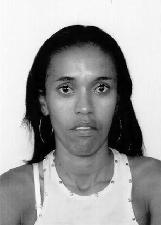
182Eliana0
Alternate · PTC · No. 36008
Coalition: PHS / PT do B / PTC
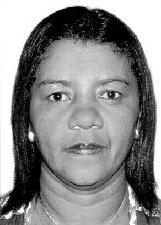
183Lucineide Pereira0
Alternate · PTC · No. 36002
Coalition: PHS / PT do B / PTC
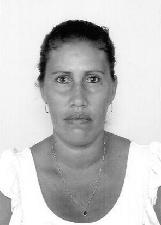
184Maria Eleni0
Alternate · PTC · No. 36003
Coalition: PHS / PT do B / PTC
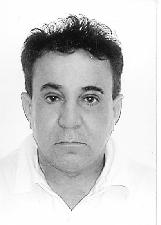
—Monção11,838
Annulled votesRejected, under appeal · PTB · No. 14141
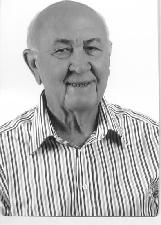
—P.henrique3,084
Annulled votesRejected · PTB · No. 14567
—João Falcão2,148
Annulled votesRejected, under appeal · PSC · No. 20111
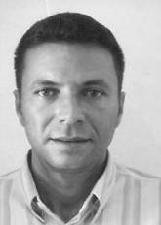
—Roberto Queiroz523
Annulled votesRejected, under appeal · PTN · No. 19777
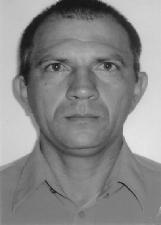
—Judson Barros247
Annulled votesRejected · PV · No. 43777
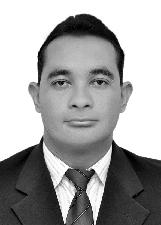
—Maestro238
Annulled votesRejected · DEM · No. 25000
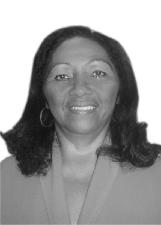
—Leonora Sá193
Annulled votesRejected, under appeal · PSC · No. 20137
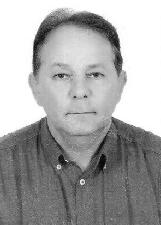
—Luiz Carlos8
Annulled votesRejected, under appeal · PT do B · No. 70456
—Zé Costa7
Annulled votesRejected, under appeal · DEM · No. 25999
—Fernando Gomes6
Annulled votesWithdrawal · PT · No. 13100
—Sérgio Rego2
Annulled votesWithdrawal · PSC · No. 20852


