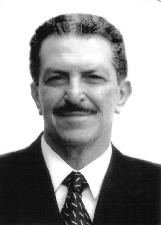
In 2010, in São Paulo, Aloysio Nunes (PSDB) and Marta Suplicy (PT) were elected to the Senate, according to data from Brazil's Superior Electoral Court (TSE).
In this election each federative unit chose TWO senators. The Federal Senate is not renewed all at once: every four years one third of the seats goes to a vote (one per state) and, four years later, two thirds (two per state). In two-seat years voters chose two different names, which is why the sum of the votes exceeds the number of voters who turned out: in 2010 there were 173,007,018 valid votes for 111,038,684 voters who turned out. It is not a counting error or a double count: a single voter could produce up to two valid votes. In one-seat years the ratio goes back to normal and valid votes fall below turnout, because blank and null votes and abstentions are left out of the count.
How many votes it takes to elect a senator, 2010
Last elected
8,314,027
Most voted
11,189,168
Top non-elected
7,773,327
See the table from 1994 to 2026
In 2026, the winner of the Senate race in São Paulo got 13,273,880 votes, among 15 candidates.
Majority race: whoever gets the most votes wins, with no party quotient. The Senate renews two thirds and one third of its seats in alternating elections: that is why the number of seats changes from one election to the next.
The table above already includes every year from 1994 onward. To see an election before 1994, choose the year in All elections in São Paulo.
3 candidacies on this list had their votes annulled, according to data from the TSE: they appear at the end, with the votes entered on the voting machines (the machine tally report), without a percentage and outside the ranking of valid votes, because these votes are not part of the valid votes. The tag next to it shows the status of the candidacy registration in the TSE data, which may still change with a decision by the Electoral Courts.
See the result by city
Registered voters30,289,723
Turned out25,310,267
Abstentions4,979,456
Blank5,617,743
Null8,224,020
Valid36,778,771
Registered voters: voters who could vote. Turnout: how many went to the polls. Abstentions: how many stayed away (registered voters − turnout). Blank and Null: those who turned out but did not choose a valid candidate. Valid: the votes that count for candidates (turnout − blank − null); percentages are calculated on them.
3 seats in the Federal Senate: the whole chamber, adding up 1 elected in 2006 and 2 elected in 2010.
PTPartido dos Trabalhadores266.67%
PSDBPartido da Social Democracia Brasileira133.33%
Elected seats, from the TSE results. This is the composition that came out of the ballot boxes, not the one the chamber had over the legislative term: anyone who switched parties after the election does not change this number. The count adds up those elected, without recalculating the quotient, so it matches the legal size of the chamber. A single party has an absolute majority.
Votes by party (all, including those that elected no one)
Each party by its total votes (candidate votes + party-list votes), including those that won no seat.
PTPartido dos Trabalhadores17,300,8302 seats
17,300,830 candidate votes
PSDBPartido da Social Democracia Brasileira11,189,1681 seat
11,189,168 candidate votes
PFL8,212,177no seat
8,212,177 candidate votes
PC do B7,773,327no seat
7,773,327 candidate votes
PV4,305,221no seat
4,305,221 candidate votes
PTB3,970,169no seat
3,970,169 candidate votes
PMDB929,179no seat
929,179 candidate votes
PSL411,661no seat
411,661 candidate votes
PTC282,714no seat
282,714 candidate votes
PSOL249,600no seat
249,600 candidate votes
PP203,443no seat
203,443 candidate votes
PSB198,660no seat
198,660 candidate votes
PDT195,817no seat
195,817 candidate votes
PSTU190,940no seat
190,940 candidate votes
PSC52,388no seat
52,388 candidate votes
PRONA42,971no seat
42,971 candidate votes
PT do B22,484no seat
22,484 candidate votes
PCO17,611no seat
17,611 candidate votes
PTN9,856no seat
9,856 candidate votes
PMN9,426no seat
9,426 candidate votes
PAN2,550no seat
2,550 candidate votes
Todas as eleições in São Paulo 31 anos, de 1933 a 2026▾
As eleições de São Paulo, ano a ano: nas eleições gerais de 1933 a 2026, a votação de cada candidato a presidente (somada no estado), governador, senador, deputado federal e deputado estadual, com a lista completa dos candidatos e quem foi eleito; nas eleições municipais de 1996 a 2024, prefeito e vereador, apurados cidade a cidade: cada uma leva às cidades de São Paulo. Escolha o ano e o cargo:
General election: president, governor, senator and deputies. Municipal election: mayor and city councillor.
The cutoff table covers from 1994 to 2026; the results by election go as far as the TSE publishes each office. Mayor and city council votes are counted city by city: in the list of elections, each one takes you to the cities in the state.
The percentage of valid votes is not shown in this table: valid votes include party-only votes, which do not go to any candidate.