Federal Deputy · 2018 · Rondônia

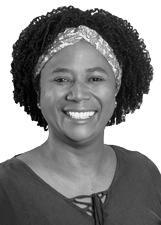
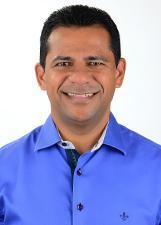
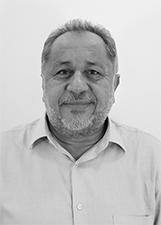
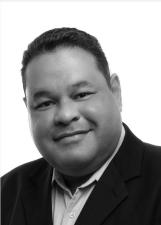
In 2018, in Rondônia, 8 federal deputies were elected, according to data from Brazil's Superior Electoral Court (TSE). The largest caucuses were those of PSL, MDB, PODE, PP, PSD, PDT, PSDB and PSB, with 1 each. The most votes went to Léo Moraes (PODE), with 69,565 votes (8.88% of the valid votes). The electoral quotient was about 97,913 votes, and the lowest vote total among those elected was 28,344: seats are allocated to the party first.

Esta eleição em uma cidade de Rondônia

Deputado federal 2018 em cada uma das 52 cidades.

Ver as 52 cidades de RO

How many votes it takes to elect a federal deputy, 2018

Quotient
97,913
Last elected
28,344
Top non-elected
28,577
See the table from 1994 to 2026

In 2026, the last federal deputy elected in Rondônia got 35,398 votes. There were 8 seats and 127 people ran.

YearSeatsCandi­datesQuo­tientCutoffMost votedTop non-elected
20268127116,61735,398158,42125,462
20228149108,64422,80685,60428,422
201889297,91328,34469,56528,577
201488199,80924,14661,41925,204
201087195,74515,026100,58934,990
200686987,71326,57365,42021,891
2002810482,35413,77739,55927,939
199885957,47315,22034,91325,413
1994868—11,68320,99612,808

The quotient is the number of votes the party needs per seat (valid votes ÷ seats); the seat goes to the party's most voted candidate. The cutoff is the lowest vote total among those elected (the entry threshold), and it is usually much lower than the quotient. The top non-elected is the highest vote total among those not elected, and it can be higher than the cutoff (it is then highlighted), because the seat belongs to the party before it belongs to the candidate. Learn about the cutoff and the quotient in the tutorial.

The table above already includes every year from 1994 onward. To see an election before 1994, choose the year in All elections in Rondônia.

General Election2018Federal DeputyRondônia (RO)

Click a candidate to see their candidacy history.

See on the map


PSL party-list vote7,0170.90%
Vote only for number 17 · Partido Social Liberal
PT party-list vote4,4770.57%
Vote only for number 13
MDB party-list vote4,2520.54%
Vote only for number 15 · Movimento Democrático Brasileiro
PDT party-list vote4,0130.51%
Vote only for number 12 · Partido Democrático Trabalhista
PP party-list vote3,5670.46%
Vote only for number 11 · Partido Progressista
PODE party-list vote3,0080.38%
Vote only for number 19 · Podemos
PRB party-list vote2,6490.34%
Vote only for number 10
PSDB party-list vote2,4490.31%
Vote only for number 45 · Partido da Social Democracia Brasileira
PSB party-list vote2,4230.31%
Vote only for number 40 · Partido Socialista Brasileiro
PTB party-list vote1,9280.25%
Vote only for number 14
DEM party-list vote1,5400.20%
Vote only for number 25
PR party-list vote1,3050.17%
Vote only for number 22
PSD party-list vote1,1770.15%
Vote only for number 55 · Partido Social Democrático
PTC party-list vote1,1260.14%
Vote only for number 36
PMN party-list vote8790.11%
Vote only for number 33
PV party-list vote7420.09%
Vote only for number 43
PHS party-list vote7320.09%
Vote only for number 31
SOLIDARIEDADE party-list vote6980.09%
Vote only for number 77
PATRI party-list vote6560.08%
Vote only for number 51
PSC party-list vote6240.08%
Vote only for number 20
REDE party-list vote5680.07%
Vote only for number 18
PPS party-list vote5600.07%
Vote only for number 23
PROS party-list vote5460.07%
Vote only for number 90
PRP party-list vote4180.05%
Vote only for number 44
NOVO party-list vote3800.05%
Vote only for number 30
DC party-list vote3040.04%
Vote only for the party number
PC do B party-list vote2900.04%
Vote only for number 65
PSOL party-list vote2290.03%
Vote only for number 50
PSTU party-list vote2050.03%
Vote only for number 16
PMB party-list vote1130.01%
Vote only for number 35
PRTB party-list vote920.01%
Vote only for number 28

9 candidacies on this list had their votes annulled, according to data from the TSE: they appear at the end, with the votes entered on the voting machines (the machine tally report), without a percentage and outside the ranking of valid votes, because these votes are not part of the valid votes. The tag next to it shows the status of the candidacy registration in the TSE data, which may still change with a decision by the Electoral Courts.

See the result by city

Registered voters1,175,133
Turned out912,914
Abstentions262,219
Blank43,183
Null86,426
Valid783,305

Registered voters: voters who could vote. Turnout: how many went to the polls. Abstentions: how many stayed away (registered voters − turnout). Blank and Null: those who turned out but did not choose a valid candidate. Valid: the votes that count for candidates (turnout − blank − null); percentages are calculated on them.

8 seats in the Chamber of Deputies, split among 8 parties. A seat is worth about ~97,913 votes: the electoral quotient (valid votes ÷ seats). Of the 8 seats, 4 came from the quota (the party reaches the quotient) and 4 from the remainders (the seats left over go, one by one, to the party with the highest average). That is why the party with the most votes takes more than its own quota.

PSLPartido Social Liberal112.50%
85,173 candidate votes + 7,017 party-list
0 from the quota + 1 from remainders
MDBMovimento Democrático Brasileiro112.50%
74,035 candidate votes + 4,252 party-list
0 from the quota + 1 from remainders
PODEPodemos112.50%
69,565 candidate votes + 3,008 party-list
1 from the quota
PPPartido Progressista112.50%
66,648 candidate votes + 3,567 party-list
1 from the quota
PSDPartido Social Democrático112.50%
44,009 candidate votes + 1,177 party-list
1 from the quota
PDTPartido Democrático Trabalhista112.50%
43,665 candidate votes + 4,013 party-list
1 from the quota
PSDBPartido da Social Democracia Brasileira112.50%
38,809 candidate votes + 2,449 party-list
0 from the quota + 1 from remainders
PSBPartido Socialista Brasileiro112.50%
30,399 candidate votes + 2,423 party-list
0 from the quota + 1 from remainders

Coalition: until 2018 parties could join a single slate, and the quotient belonged to the coalition, not to each party. Seats went to the alliance and then to the candidates with the most votes within it. That is why a small party could elect someone by riding on the group's total. Use Group by coalition above to see who ran together. From 2020 on this ended in proportional elections; what exists today is the federation, which is permanent: parties that federate must stay together for at least 4 years, nationwide and during the term, not only for the election.

Elected seats, from the TSE results. This is the composition that came out of the ballot boxes, not the one the chamber had over the legislative term: anyone who switched parties after the election does not change this number. The count adds up those elected, without recalculating the quotient, so it matches the legal size of the chamber.

Votes by party (all, including those that elected no one)

Each party by its total votes (candidate votes + party-list votes), including those that won no seat. The number on the right is how many electoral quotients the party added up (votes ÷ quotient): below 1.0 it did not reach, on its own, the cost of a seat, but it could still elect through the coalition or the remainders.

PSLPartido Social Liberal92,1901 seat
85,173 candidate votes + 7,017 party-list · 0.9 quotient
MDBMovimento Democrático Brasileiro78,2871 seat
74,035 candidate votes + 4,252 party-list · 0.8 quotient
PODEPodemos72,5731 seat
69,565 candidate votes + 3,008 party-list · 0.7 quotient
PPPartido Progressista70,2151 seat
66,648 candidate votes + 3,567 party-list · 0.7 quotient
DEM49,208no seat
47,668 candidate votes + 1,540 party-list · 0.5 quotient
PDTPartido Democrático Trabalhista47,6781 seat
43,665 candidate votes + 4,013 party-list · 0.5 quotient
PSDPartido Social Democrático45,1861 seat
44,009 candidate votes + 1,177 party-list · 0.5 quotient
PSDBPartido da Social Democracia Brasileira41,2581 seat
38,809 candidate votes + 2,449 party-list · 0.4 quotient
PSBPartido Socialista Brasileiro32,8221 seat
30,399 candidate votes + 2,423 party-list · 0.3 quotient
PR32,272no seat
30,967 candidate votes + 1,305 party-list · 0.3 quotient
SOLIDARIEDADE29,275no seat
28,577 candidate votes + 698 party-list · 0.3 quotient
PMN27,721no seat
26,842 candidate votes + 879 party-list · 0.3 quotient
PRB27,435no seat
24,786 candidate votes + 2,649 party-list · 0.3 quotient
PTB23,823no seat
21,895 candidate votes + 1,928 party-list · 0.2 quotient
PROS22,477no seat
21,931 candidate votes + 546 party-list · 0.2 quotient
PSC20,921no seat
20,297 candidate votes + 624 party-list · 0.2 quotient
PT18,081no seat
13,604 candidate votes + 4,477 party-list · 0.2 quotient
PV13,378no seat
12,636 candidate votes + 742 party-list · 0.1 quotient
PATRI8,533no seat
7,877 candidate votes + 656 party-list · 0.1 quotient
REDE8,464no seat
7,896 candidate votes + 568 party-list · 0.1 quotient
PHS6,019no seat
5,287 candidate votes + 732 party-list · 0.1 quotient
NOVO5,473no seat
5,093 candidate votes + 380 party-list · 0.1 quotient
PPS2,638no seat
2,078 candidate votes + 560 party-list · 0.0 quotient
PTC2,362no seat
1,236 candidate votes + 1,126 party-list · 0.0 quotient
PRP1,564no seat
1,146 candidate votes + 418 party-list · 0.0 quotient
PSOL1,340no seat
1,111 candidate votes + 229 party-list · 0.0 quotient
PC do B843no seat
553 candidate votes + 290 party-list · 0.0 quotient
PSTU456no seat
251 candidate votes + 205 party-list · 0.0 quotient
PRTB357no seat
265 candidate votes + 92 party-list · 0.0 quotient
DC304no seat
0 candidate votes + 304 party-list · 0.0 quotient
PMB152no seat
39 candidate votes + 113 party-list · 0.0 quotient
Todas as eleições in Rondônia 26 anos, de 1958 a 2026

As eleições de Rondônia, ano a ano: nas eleições gerais de 1958 a 2026, a votação de cada candidato a presidente (somada no estado), governador, senador, deputado federal e deputado estadual, com a lista completa dos candidatos e quem foi eleito; nas eleições municipais de 1996 a 2024, prefeito e vereador, apurados cidade a cidade: cada uma leva às cidades de Rondônia. Escolha o ano e o cargo:

  1. 2026President 2026Governor 2026Senator 2026Federal deputy 2026State deputy 2026
  2. 2024Mayor 2024Mayor 2024, RunoffCity Councillor 2024
  3. 2022President 2022President 2022, RunoffGovernor 2022Governor 2022, RunoffSenator 2022Federal deputy 2022State deputy 2022
  4. 2020Mayor 2020Mayor 2020, RunoffCity Councillor 2020
  5. 2018President 2018President 2018, RunoffGovernor 2018Governor 2018, RunoffSenator 2018Federal deputy 2018State deputy 2018
  6. 2016Mayor 2016Mayor 2016, RunoffCity Councillor 2016
  7. 2014President 2014President 2014, RunoffGovernor 2014Governor 2014, RunoffSenator 2014Federal deputy 2014State deputy 2014
  8. 2012Mayor 2012Mayor 2012, RunoffCity Councillor 2012
  9. 2010President 2010President 2010, RunoffGovernor 2010Governor 2010, RunoffSenator 2010Federal deputy 2010State deputy 2010
  10. 2008Mayor 2008City Councillor 2008
  11. 2006President 2006President 2006, RunoffGovernor 2006Senator 2006Federal deputy 2006State deputy 2006
  12. 2004Mayor 2004Mayor 2004, RunoffCity Councillor 2004
  13. 2002President 2002President 2002, RunoffGovernor 2002Governor 2002, RunoffSenator 2002Federal deputy 2002State deputy 2002
  14. 2000Mayor 2000City Councillor 2000
  15. 1998President 1998Governor 1998Governor 1998, RunoffSenator 1998Federal deputy 1998State deputy 1998
  16. 1996Mayor 1996City Councillor 1996
  17. 1994President 1994Governor 1994Governor 1994, RunoffSenator 1994Federal deputy 1994State deputy 1994
  18. 1990Governor 1990Governor 1990, RunoffSenator 1990Federal deputy 1990State deputy 1990
  19. 1986Governor 1986Senator 1986Federal deputy 1986State deputy 1986
  20. 1982Senator 1982Federal deputy 1982State deputy 1982
  21. 1978Federal deputy 1978
  22. 1974Federal deputy 1974
  23. 1970Federal deputy 1970
  24. 1966Federal deputy 1966
  25. 1962Federal deputy 1962
  26. 1958Federal deputy 1958

General election: president, governor, senator and deputies. Municipal election: mayor and city councillor.

The cutoff table covers from 1994 to 2026; the results by election go as far as the TSE publishes each office. Mayor and city council votes are counted city by city: in the list of elections, each one takes you to the cities in the state.

The percentage of valid votes is not shown in this table: valid votes include party-only votes, which do not go to any candidate.

Search