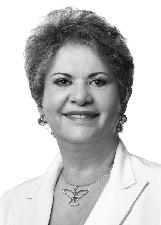
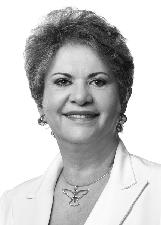
Wilma de Faria reported income and spending to the TSE in 4 campaigns: governor for Rio Grande do Norte in 2006, senator for Rio Grande do Norte in 2010 and 2014, and city councillor in Natal (RN) in 2016. The amounts are those of the time of each campaign, not adjusted for inflation. In the most recent campaign, in 2016, reported R$ 151 thousand in income: R$ 445 de outras campanhas, R$ 52 thousand from private donations (91 donors) and R$ 98 thousand from own funds. Contracted spending totals R$ 150 thousand, mainly on production of radio, television or video programs (R$ 87 thousand) and vehicle lending or rental (R$ 13 thousand). In 2014, 49% of the R$ 9.5 million in committed spending went to production of radio, television or video programs; in 2010, R$ 3.6 million in committed spending.
Income in 2016R$ 151 thousandcampaign closed
Spending in 2016R$ 150 thousandcontracted
Spending in 2014R$ 9.5 millioncontracted, campaign closed
Campaigns42006, 2010, 2014 and 2016
Fundraising, where the money came from:
- Other resources from the party and other campaigns
- Donations from individuals (includes crowdfunding)
- Companies (until 2014)
- Own funds
- Other sources
Raised
R$ 151 thousand
91 individual donors
party and other campaigns less than 1% · individuals 35% · own funds 65%
Spending contracted
R$ 150 thousand
the TSE does not publish the amount paid for this year
- Production of radio, television or video programsR$ 87 thousand57.5%
- Vehicle lending or rentalR$ 13 thousand8.9%
- Fuel and lubricantsR$ 10 thousand6.7%
- Activists and street mobilizationR$ 8 thousand5.6%
- 9 other categoriesincludes R$ 730 entered as "miscellaneous, to be specified"R$ 32 thousand21.3%
Raised
R$ 9.5 million
6 individual donors
party and other campaigns 92% · individuals less than 1% · companies 8% · own funds less than 1%
Spending contracted
R$ 9.5 million
the TSE does not publish the amount paid for this year
- Production of radio, television or video programsR$ 4.6 million49.0%
- Printed materialsR$ 1.4 million14.2%
- Third-party servicesR$ 224 thousand2.4%
- Vehicle lending or rentalR$ 194 thousand2.0%
- 17 other categoriesincludes R$ 1.7 million entered as "miscellaneous, to be specified" and R$ 766 thousand donated to other candidates and partiesR$ 3.1 million32.4%
Raised
R$ 3.6 million
9 individual donors
party and other campaigns 54% · individuals less than 1% · companies 45%
Spending contracted
R$ 3.6 million
the TSE does not publish the amount paid for this year
- Printed materialsR$ 606 thousand16.8%
- Vehicle lending or rentalR$ 288 thousand8.0%
- Candidacy promotion eventsR$ 111 thousand3.1%
- Election polls or testsR$ 100 thousand2.8%
- 17 other categoriesincludes R$ 1.4 million entered as "miscellaneous, to be specified" and R$ 840 thousand donated to other candidates and partiesR$ 2.5 million69.3%
See the previous campaign
Raised
R$ 4.9 million
21 individual donors
party and other campaigns 5% · individuals 9% · companies 72% · own funds less than 1% · other 14%
Spending contracted
R$ 4.9 million
the TSE does not publish the amount paid for this year
- Production of radio, television or video programsR$ 1.3 million26.8%
- Fuel and lubricantsR$ 849 thousand17.3%
- Locação/cessão de bens móveisR$ 667 thousand13.6%
- Printed materialsR$ 549 thousand11.2%
- 21 other categoriesincludes R$ 305 thousand entered as "miscellaneous, to be specified" and R$ 380 thousand donated to other candidates and partiesR$ 1.5 million31.1%
Running mates and alternates do not have their own campaign account: the account is that of the main candidate's ticket.
Source: campaign finance reports filed with the TSE (open data). Radar do Voto has these data from 2006 on in general elections and from 2008 on in municipal elections; earlier campaigns do not appear. Contracted spending is the total of the expenses the campaign reported; paid is the part already settled (the TSE only publishes the paid amount from 2018 on). The spending categories are the TSE's; the detail by supplier is in the dashboard. Corporate donations have been prohibited since 2015.
See donors, suppliers and spending ›